


GBP/USD looks like it may have more room to go on the upside, but at this very moment price is extended. USD/CAD is on the verge of a significant breakdown, below 13000 will further this notion along. AUD/USD is up against a test of resistance amidst a strong downtrend, will it act as it did in September?
Technical Highlights:
- GBP/USD extended, on hold for the moment
- USD/CAD on the verge of breaking major support
- AUD/USD runs into resistance, trend still weak
For forecasts and educational guides, check them out on the DailyFX Trading Guides page.
GBP/USD extended, on hold for the moment
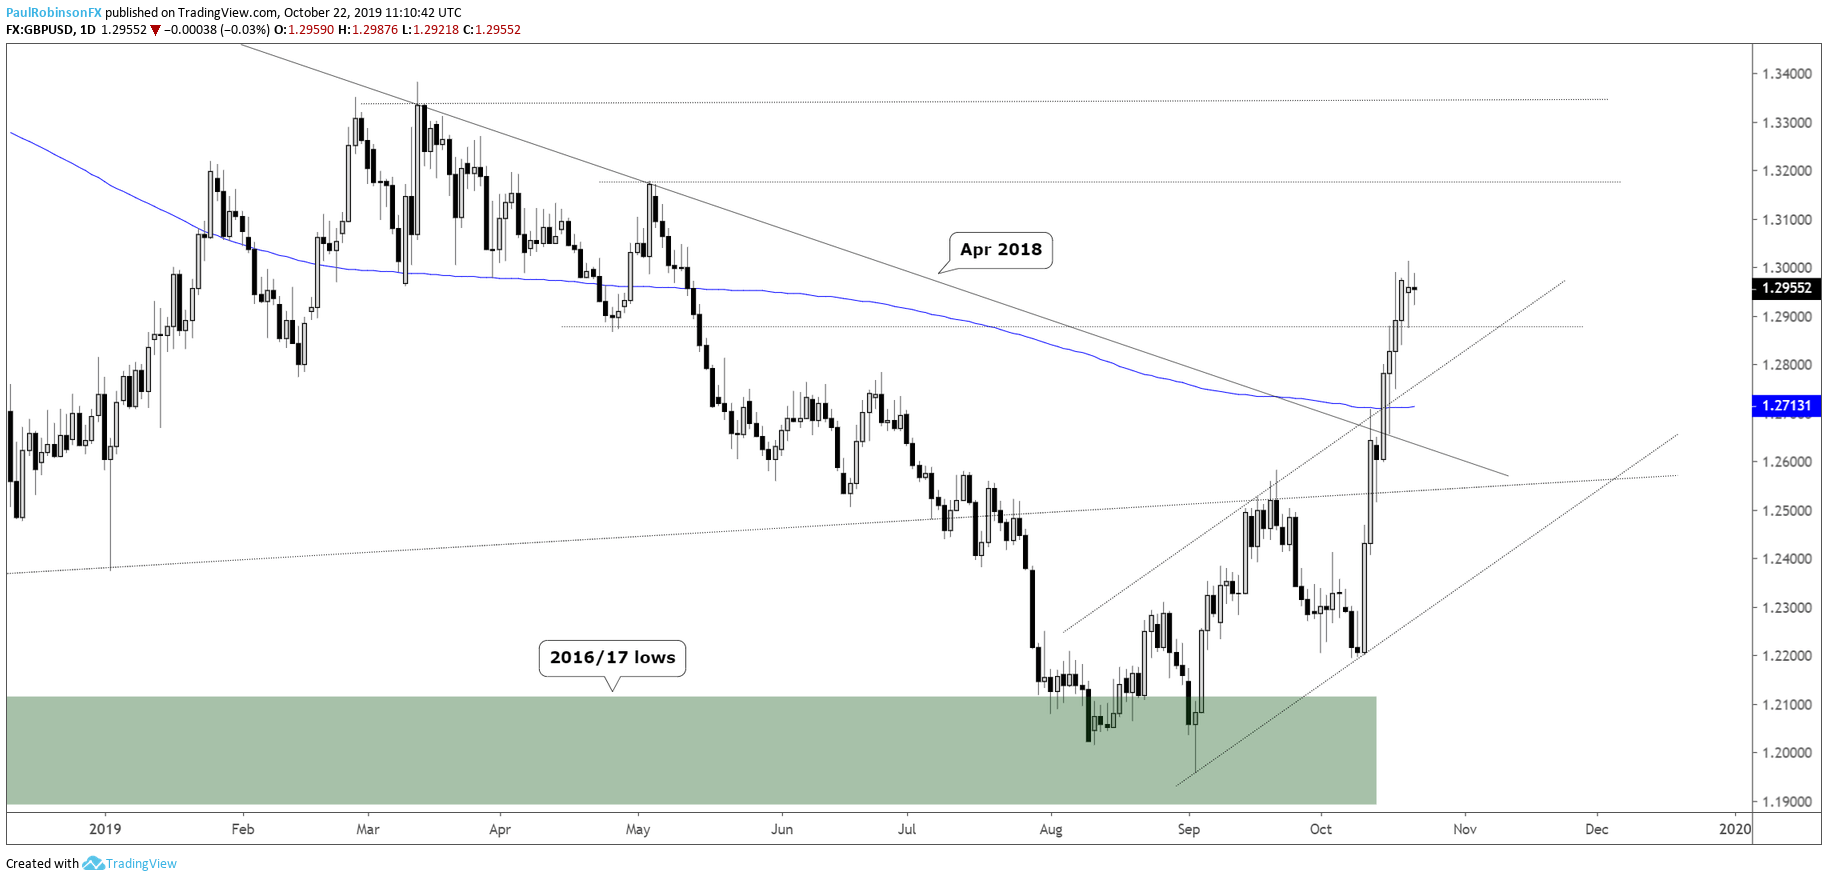
GBP/USD has the market leaning the wrong way evidenced by its extraordinarily strong run in the near-term matching up with some of the biggest spikes in decades. It is short-term overbought, but barring a major reversal in recent Brexit momentum there is room to run to the May high at 13170 and March high near 13400. For now, waiting for price to digest a bit to see how the rally wants to hold, but it may not be long before another surge comes.
GBP/USD Daily Chart (overbought, but not yet at resistance)
USD/CAD on the verge of breaking major support
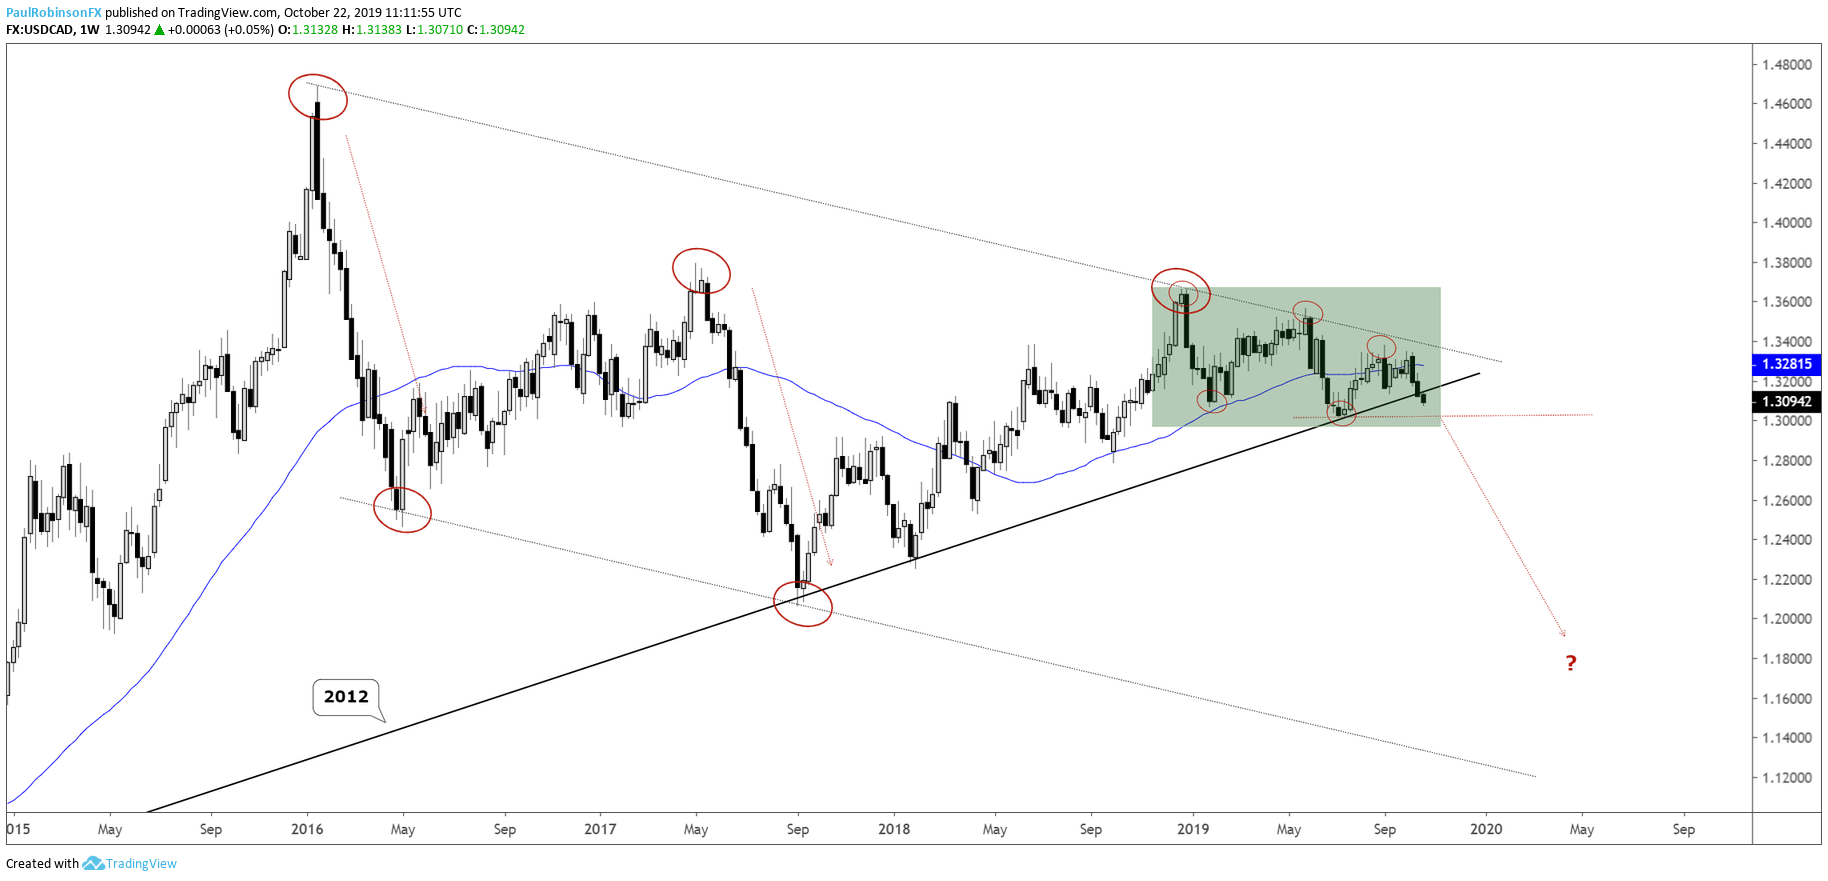
USD/CAD is cracking the 2012 trend-line, and on that a ‘3-2’ pattern in place since December is on the verge of cracking open an even bigger ‘3-2’ pattern off the 2016 high. The 3-2 formation is marked by three highs and two lows, with the price eventually catching momentum once the second low is broken. With this all taking shape around the 2012 trend-line, the timing is especially interesting. A break of 13000 is viewed as confirmation and could start a strong downtrend into year-end.
USD/CAD Weekly Chart (‘3-2’ pattern at 2012 trend-line)
USD/CAD Daily Chart (lower-low below 13000 could be big)

AUD/USD runs into resistance, trend still weak
AUD/USD has caught a solid bid recently, but can it last with the trend since last year so weak? It bounced hard in September but that was short-lived, could be similar this time. If there is a currency against the Dollar that might not act so well, it could very well be the Australian Dollar.
AUD/USD Daily Chart (watch for pullback from resistance

Resources for Forex & CFD Traders
Whether you are a new or an experienced trader, DailyFX has several resources available to help you; indicator for tracking trader sentiment, quarterly trading forecasts, analytical and educational webinars held daily, trading guides to help you improve trading performance, and one specifically for those who are new to forex.
---Written by Paul Robinson, Market Analyst
You can follow Paul on Twitter at @PaulRobinsonFX


