


The US Dollar Index (DXY) is trying to make a run at higher levels, but needs to break free from the technical structure that has been building since over a year ago. The Euro is at a new cycle low, but can it continue without bouncing as it has month after month. AUDUSD is declining into a rather significant level of support built up during the summer.
Technical Highlights:
- US Dollar Index (DXY) trying to break out of channel structure
- EURUSD at a new cycle low, but can it continue?
- AUDUSD is trading into a significant level of support
For forecasts and educational guides, check them out on the DailyFX Trading Guides page.
US Dollar Index (DXY) trying to break out of channel structure
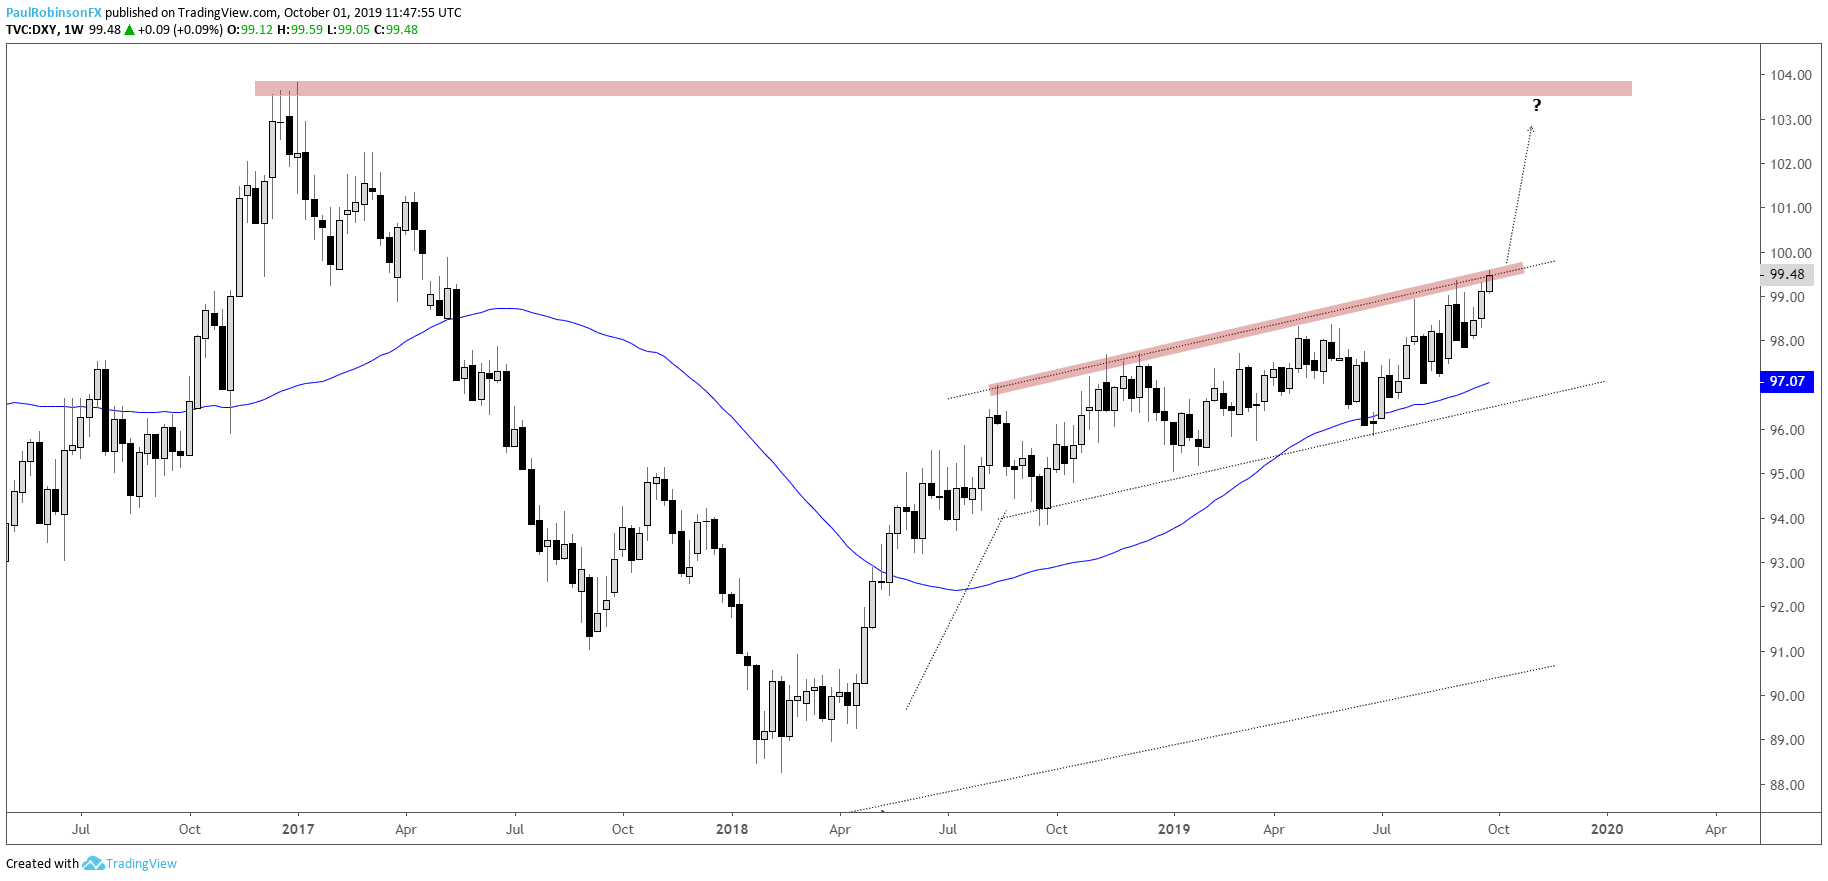
The US Dollar Index (DXY) is pressing up against the top-side channel line from August of last year. This has ben a line that continues to be problematic for the DXY to continue to rise, but if price can close above on a weekly basis (maybe this week?), then the long-awaited momentum-move may be here.
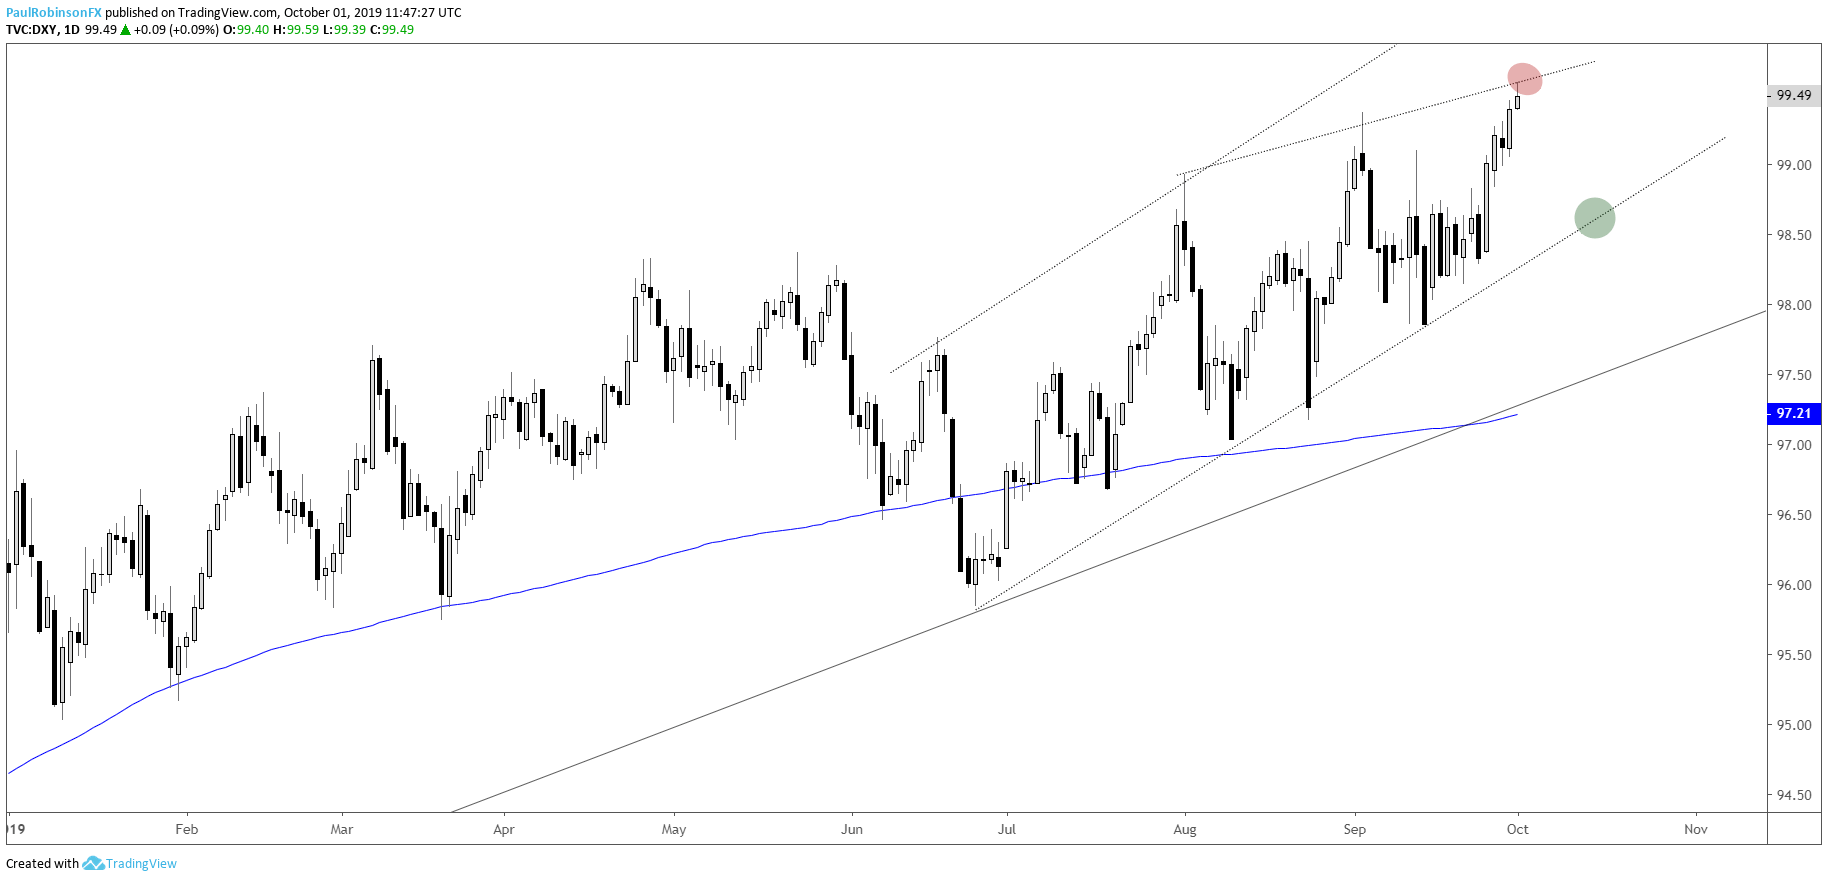
But if not, and there are short-term forces also work against USD here, then a pullback may be in order, something that would be in-line with the back-and-forth choppy price action in place since last year. In the event of a decline, look for the June trend-line to act as a solid line of support.
US Dollar Index (DXY) Weekly Chart (needs to climb above upper parallel)
U.S. Dollar Currency Index (DXY) Charts by TradingView
US Dollar Index (DXY) Daily Chart (near-term top-side trend-line)
EURUSD at a new cycle low, but can it continue?
EURUSD is ~57% of the DXY, which makes it the main driver of the index. It is at a new cycle low since topping last year. The sequence has been to drop to new low and then quickly bounce, but with the Euro below all levels of support, including the November 2017 trend-line, perhaps this won’t be the case and the French election gap in April of 2017 can finally get filled, and possibly worse.
EURUSD Daily Chart (new cycle low)

AUDUSD is trading into a significant level of support
AUDUSD is weakening into a familiar are of support in the tight range of 6689/77. Between August 3 and September 7 Aussie posted strong reactions at those levels, making it a significant area of support. Watch closely how price reacts here as it quickly approaches. A bounce may be in order before trading on through. Short-term shorts will want to be on their toes while would-be longs may be waiting to see if the level is going to hold.
AUDUSD Daily Chart (big support test)

Resources for Forex & CFD Traders
Whether you are a new or an experienced trader, DailyFX has several resources available to help you; indicator for tracking trader sentiment, quarterly trading forecasts, analytical and educational webinars held daily, trading guides to help you improve trading performance, and one specifically for those who are new to forex.
---Written by Paul Robinson, Market Analyst
You can follow Paul on Twitter at @PaulRobinsonFX


