


The U.S. stock market appears in jeopardy of rolling over with a vengeance, with it will go other global markets. The DAX and FTSE have similar technical patterns forming, the latter the cleanest looking so far (surprisingly). Crude oil has geopolitical risks to the upside and global slowdown/risk-off concerns for the downside – which will win out?
Technical Highlights:
- Dow Jones could soon roll over, watch the NDX
- DAX and FTSE both posting similar topping patterns
- Crude oil in limbo, but the downside looks more at risk
Make more informed decisions by checking out our trading forecasts and educational resources on the DailyFX Trading Guides page.
Dow Jones could soon roll over, watch the NDX
The U.S. markets look like they could be headed for trouble, especially if the Nasdaq 100 (which is comprised of some of the world’s bull market leaders) triggers the big-picture rising wedge by breaking the December trend-line the index currently sits on.
Turning to the Dow, it has been holding up relatively well but that could quickly change. For now it appears headed towards filling the September 5 gap and testing the top of the range created during much of August. Below there the December trend-line will become a major focal point. If the Dow gets to that point that almost certain means the NDX will have triggered the rising wedge, breaking the December trend-line (and 200-day) may just become a formality.
Dow Jones Daily Chart (rolling over towards important support)

Dow Jones Chart by TradingView
Nasdaq 100 Daily Chart (Dec t-line is bottom of rising wedge)

Nasdaq 100 Chart by TradingView
DAX and FTSE both posting similar topping patterns
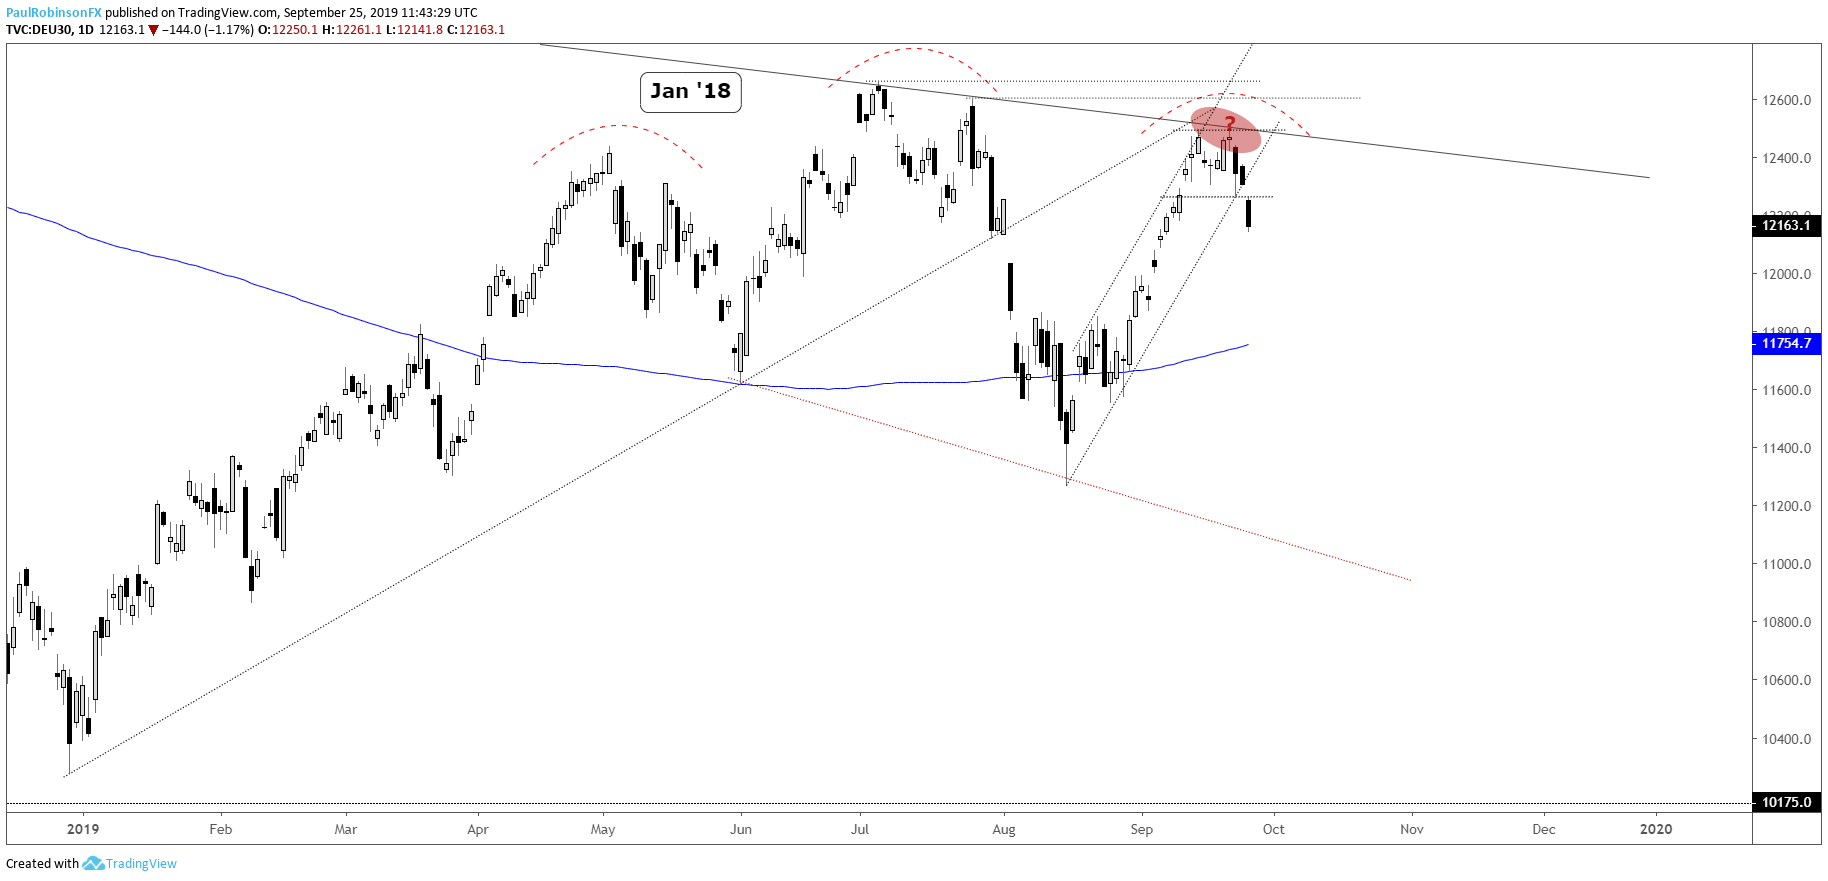
The DAX is rolling lower from the January 2018 trend-line, breaking a loose channel. The trading bias with the breakdown is for shorts on rallies. Bigger picture the right shoulder of a head-and-shoulders (H&S) could have just been cemented.
DAX Daily Chart (turn off t-line, H&S could be in the works…)
The FTSE is trading around the 200-day, so keep an eye on how it acts in the very near-term. But looking at the broader picture, a break of the ascending wedge quite possibly is cementing the right shoulder of an H&S formation. How it reacts to the neckline and 2016 trend-line may be next in the conversation.
FTSE Daily Chart (wedge broken, H&S coming closer into view)

Crude oil in limbo, but the downside looks more at risk
Crude oil is caught in limbo between geopolitical tensions and a weakening economic/stock market backdrop. In the near-term, still looking for last week’s massive gap to get filled down to 54.83, with an eye on the trend-line off the August low.
Crude Oil Daily Chart (watch gap-fill, t-line)

Crude Oil Chart by TradingView
Resources for Index & Commodity Traders
Whether you are a new or an experienced trader, DailyFX has several resources available to help you; indicator for tracking trader sentiment, quarterly trading forecasts, analytical and educational webinars held daily, and trading guides to help you improve trading performance.
We also have a series of guides for those looking to trade specific markets, such as the S&P 500, Dow, DAX, gold, silver, crude oil, and copper.
---Written by Paul Robinson, Market Analyst
You can follow Paul on Twitter at @PaulRobinsonFX


