


The S&P 500 broke out a multi-week range last week and is looking to test the record high or better, but a big-picture top-side trend-line stands in the way. Gold is backed down into the first line of support, it’s anticipated to hold for now, but long-term levels still remain a major headwind. Crude oil has been lifting but that is currently being challenged as a trend-line from last year stands in the way.
Technical Highlights:
- S&P 500 out of range, looking at prior record highs
- Gold price is finding some support, but has major headwinds
- Crude oil is picking a fight with a trend-line from last year
Make more informed decisions by checking out our trading forecasts and educational resources on the DailyFX Trading Guides page.
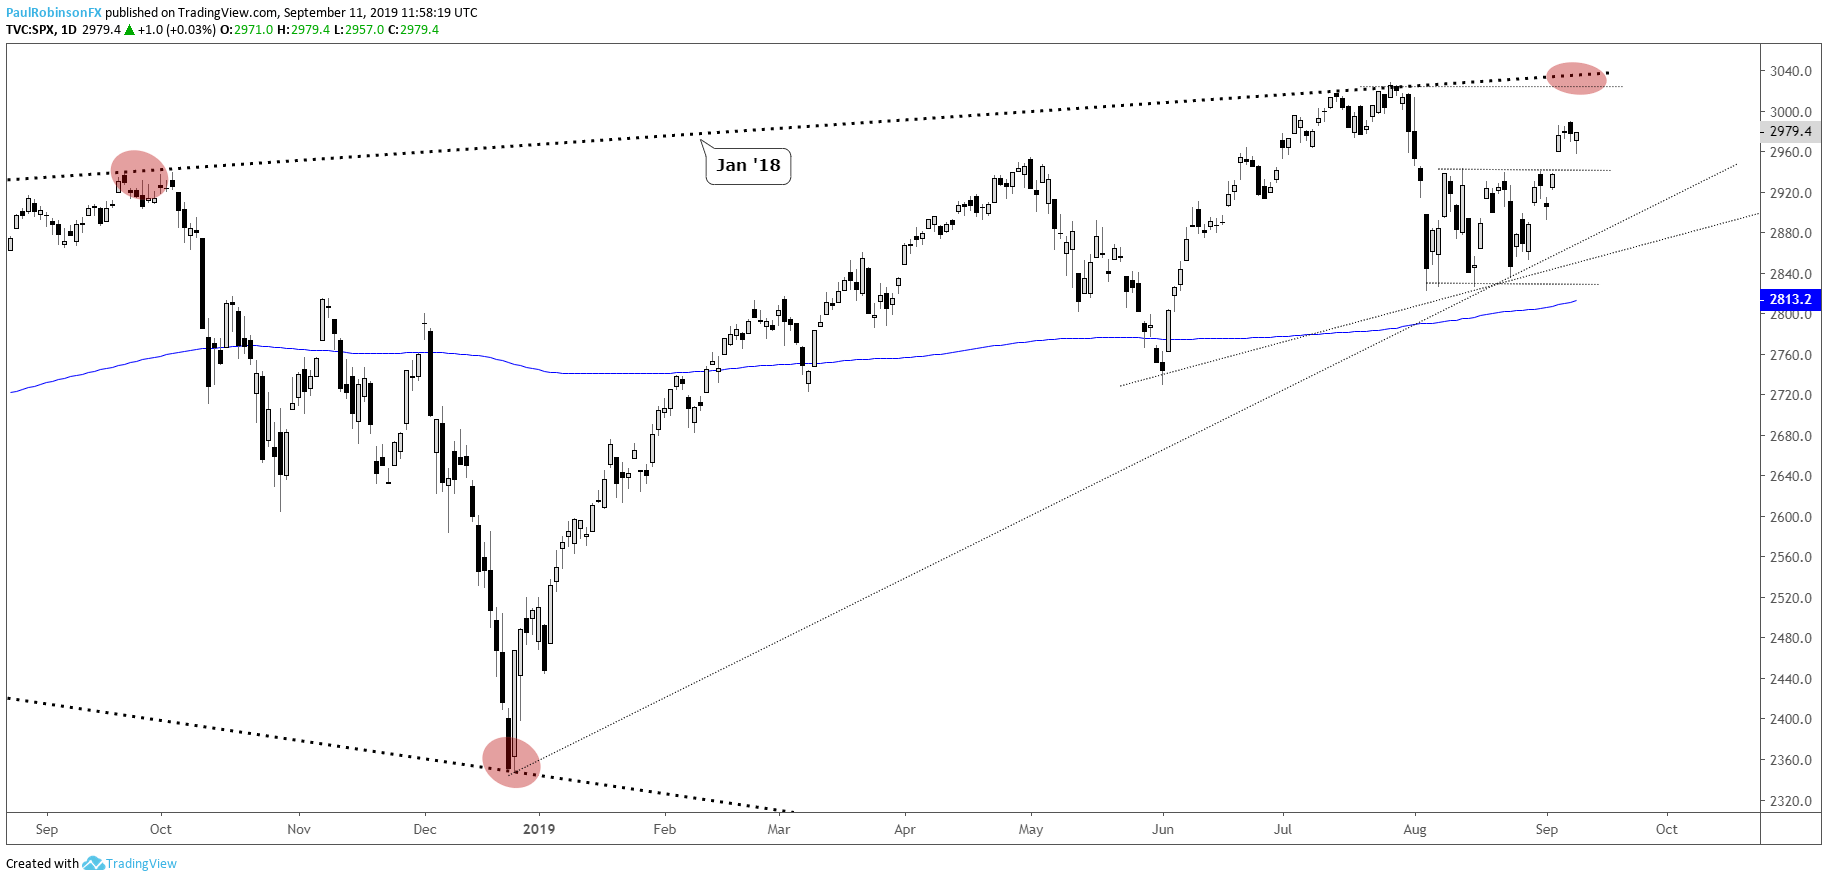
S&P 500 out of range, looking at prior record highs
The S&P 500 recently broke out of a multi-week range, and on that it skewed the bias of the market back to the upside. There isn’t much preventing the SPX from rising up to the record high at 3028, but should it do so it may be difficult for further gains beyond that point as the trend-line running over from peaks in 2018 crosses over. This may turn out to be another solid sell point. Should the market fail back inside the range without reaching resistance, under 2930 on a closing basis, look for weakness to take it back down to the bottom of the range at 2822.
S&P 500 Daily Chart (range-break, resistance ahead)
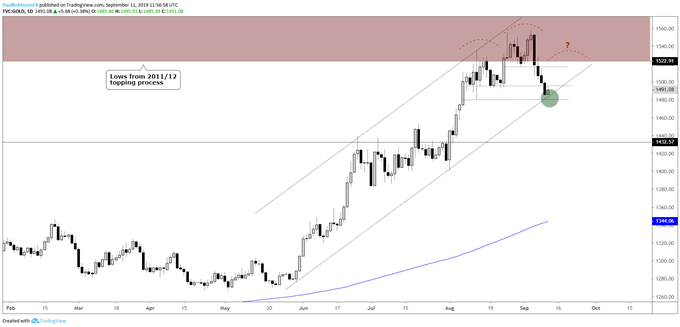
Gold price is finding some support, but has major headwinds
The price of gold has been fading as of late, but that may be coming to an end, at least in the near-term. The lower parallel from late-May is crossing right under current levels. A bounce is anticipated, but could be only temporary as major resistance from 2011/12 remains in the way. A small head-and-shoulders pattern may emerge on a bounce and fail. A scenario we will revisit should it become relevant.
Gold Price Chart (first line of support, resistance still a big problem)
Gold Price Chart by Tradingview
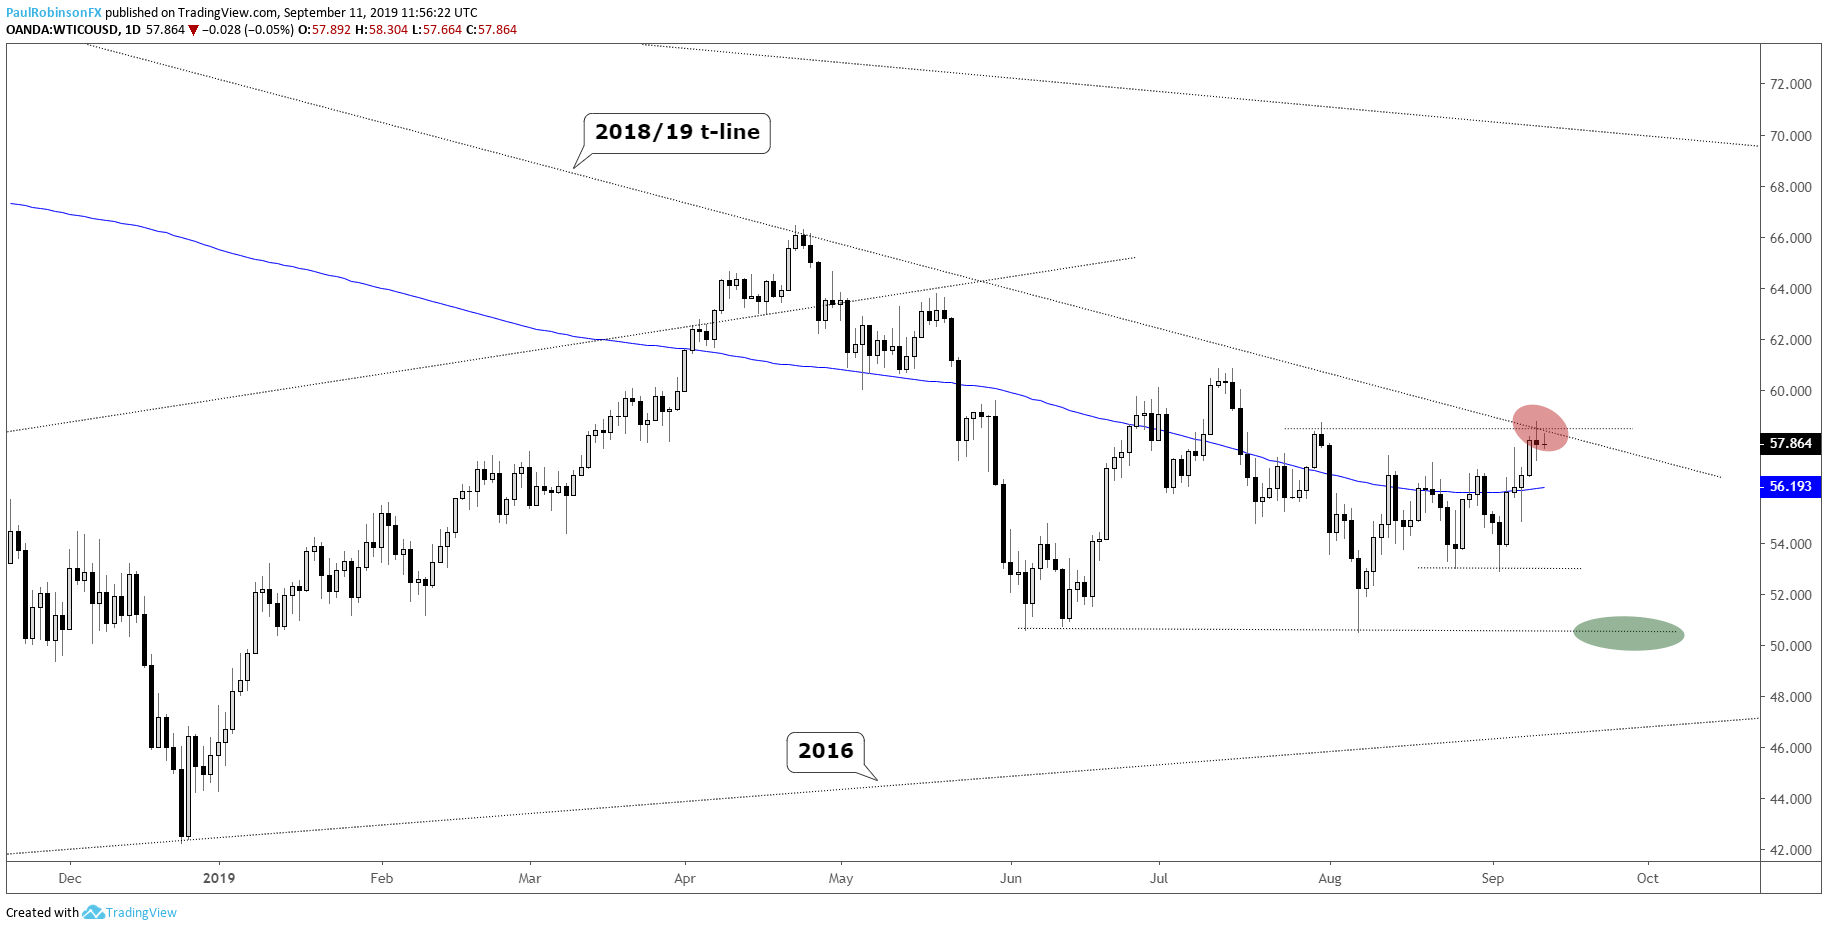
Crude oil is picking a fight with a trend-line from last year
The small rally in crude oil could come under fire again here shortly. It is trading at a trend-line that connects the 2018 and 2019 highs. Yesterday, a Doji was posted and suggests a power struggle. As long as a break above the candlestick high (58.77) doesn’t hold, look for oil to at least undergo a pullback. If a close develops above the candle high (> trend-line), then further strength could develop.
WTI Oil Daily Chart (trend, resistance against it)
Resources for Index & Commodity Traders
Whether you are a new or an experienced trader, DailyFX has several resources available to help you; indicator for tracking trader sentiment, quarterly trading forecasts, analytical and educational webinars held daily, and trading guides to help you improve trading performance.
We also have a series of guides for those looking to trade specific markets, such as the S&P 500, Dow, DAX, gold, silver, crude oil, and copper.
---Written by Paul Robinson, Market Analyst
You can follow Paul on Twitter at @PaulRobinsonFX


