


USD, EUR/USD, GBP/USD, USD/CAD, USD/CHF Talking Points:
- It’s been a busy backdrop around the US Dollar on the heels of yesterday’s FOMC rate decision.
- More recently, additional tariffs on China have been announced, helping to wipe away a chunk of yesterday’s topside run in the Dollar.
- DailyFX Forecasts are published on a variety of markets such as Gold, the US Dollar or the Euro and are available from the DailyFX Trading Guides page. If you’re looking to improve your trading approach, check out Traits of Successful Traders. And if you’re looking for an introductory primer to the Forex market, check out our New to FX Guide.
US Dollar Rips, then Dips in 24 Hours After FOMC
It’s been a busy past 24 hours after the FOMC rate decision, and despite the fact that the bank cut rates for the first time in ten years, a number of questions remain on a number of fronts. Price action in the wake of that rate cut could best be classified as ‘messy.’ A mid-day announcement of even more tariffs on China has helped to reverse that prior trend of USD-strength that showed on the heels of the FOMC rate cut. This has built in a possible bearish pin bar formation on the US Dollar, which could keep the door open for bearish reversal approaches heading into tomorrow’s NFP report.
As usual, I attempted to keep the board balanced by looking at setups on either side of the US Dollar ahead of tomorrow’s NFP report.
US Dollar Daily Price Chart
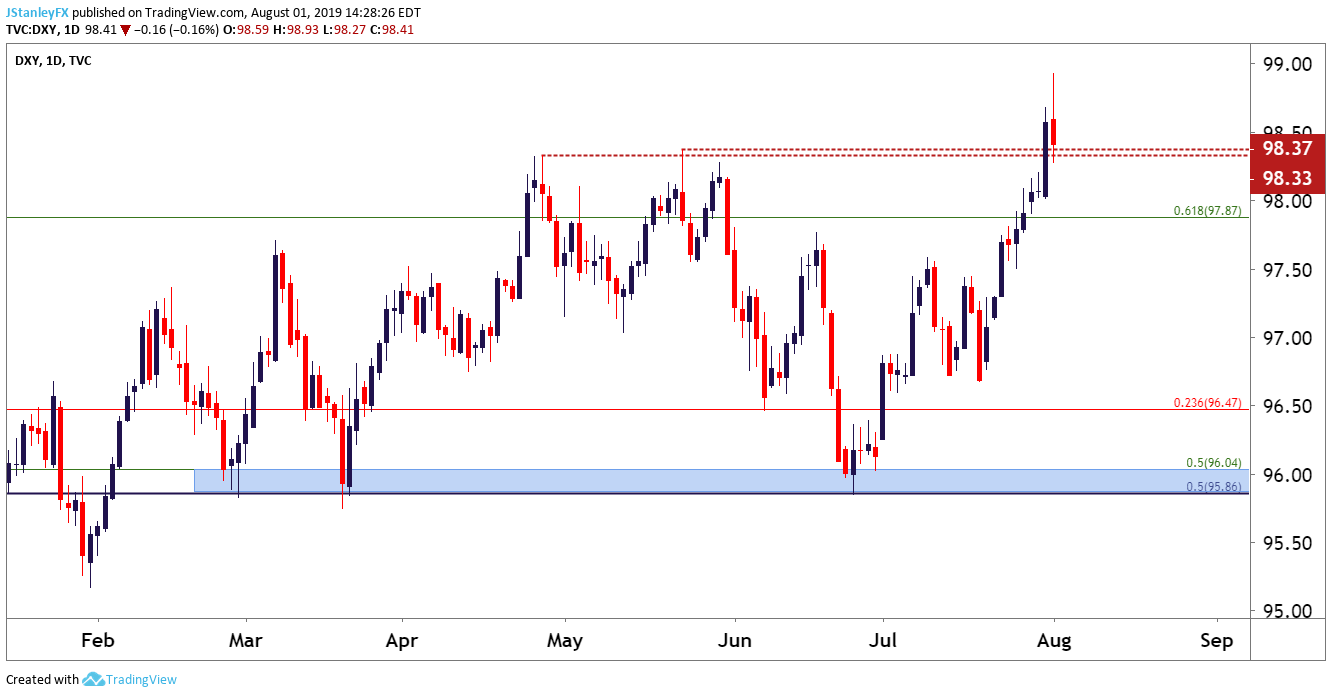
Chart prepared by James Stanley; created with Tradingview (chart link)
The first chart I looked at to start this webinar was the S&P 500 which, at the time, had seen prices extend all the way up towards those prior all-time-highs. As I had remarked, that was not a good level to chase from, instead looking to 2960 for support potential. During the webinar, prices scaled-lower in a very quick manner and that support has already come into play. The big question at this point is whether it can hold into tomorrow’s NFP report.
S&P 500 Two-Hour Price Chart

Chart prepared by James Stanley; created with Tradingview (chart link)
EUR/USD Finally Breaks – Now What?
On the long side of the US Dollar, EUR/USD may now be of attraction. The pair finally broke below the 1.1100 level on the heels of yesterday’s FOMC, and with a number of questions revolving around the bank’s future stance, that dovish outlay from the ECB last week might be one of the few areas of certainty that traders can pick on at the moment. There was an after-the-fact on the heels of last week’s ECB meeting that policymakers are expecting to cut rates by 10 basis points in September. At least it’s something? Nonetheless, this can keep the door open for a 1.1000 test. As shared in the webinar, I wanted to see a test of resistance at prior support from the 1.1100 handle that was so difficult to break on the way down.
EUR/USD Eight-Hour Price Chart
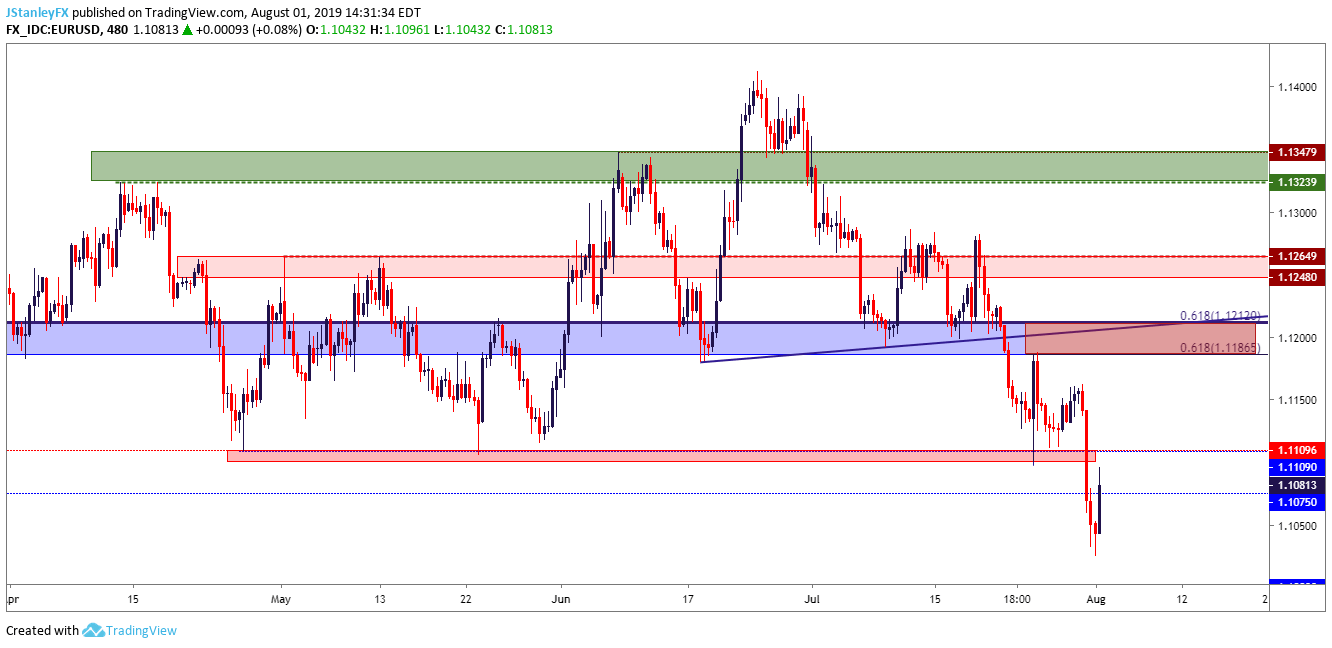
Chart prepared by James Stanley; created with Tradingview (chart link)
GBP/USD Reversal Potential
The British Pound has been a mess of recent, driven to fresh two-year-lows on the back of some brutal uncertainty around Brexit. But a long-term area of support soon came into play this morning and so far, support has held from a long-term trendline projection. And as discussed on the piece posted on Zerohedge earlier today, this can keep the door open for reversal potential in the pair.
GBP/USD Monthly Price Chart
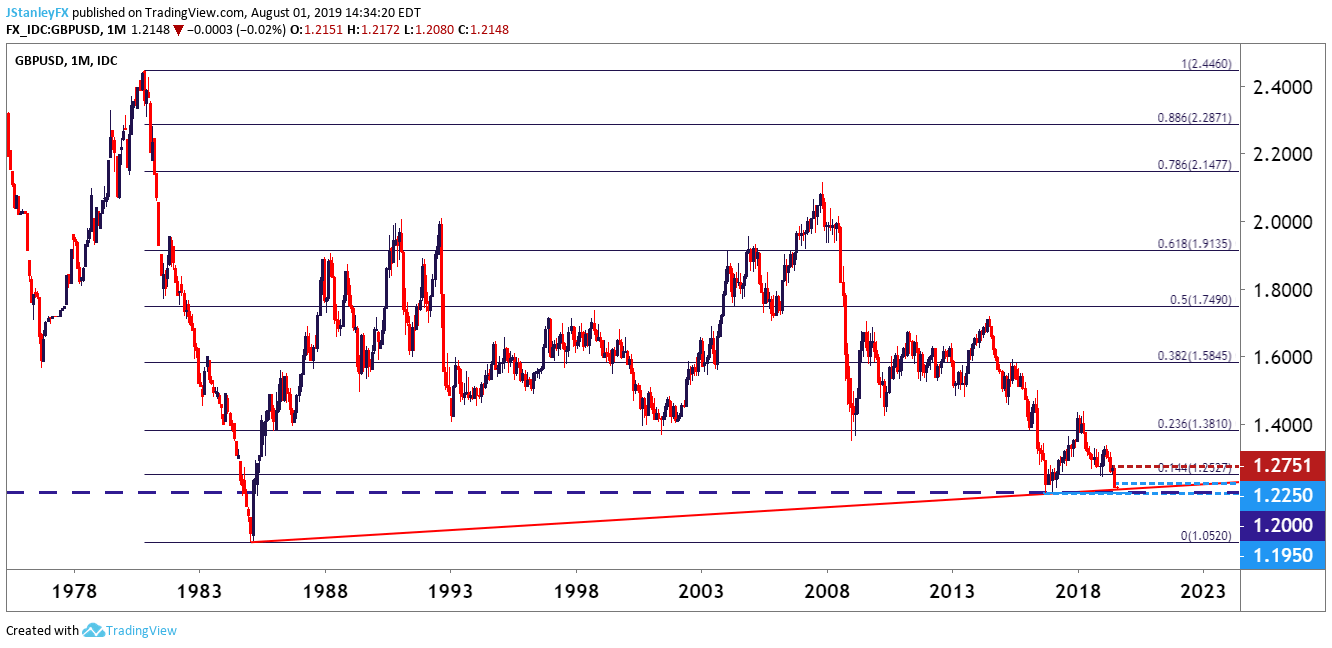
Chart prepared by James Stanley; created with Tradingview (chart link)
USD/CAD Comes Pips From Final Target, Pulls Back
On the long side of the US Dollar, USD/CAD remains of interest. I had looked at the pair again coming into this week, continuing a reversal theme that I’ve been working with from the week prior. After price action built into a falling wedge with a seeming refusal of sellers to re-test 1.3000, prices have shot higher over the past two weeks and came a mere few pips away from my final target in the zone that runs from 1.3250-1.3300. But, as discussed in the webinar, there’s no evidence yet that this bullish theme is over, and this can keep the door open for more. The support zone identified for higher-low support, taken from 1.3185-1.3200 has already come into play. The big question now is whether buyers will be able to punch up to the 1.3250-1.3300 zone of resistance potential.
USD/CAD Two-Hour Price Chart

Chart prepared by James Stanley; created with Tradingview (chart link)
USD/JPY Puts in a Monster Day After FOMC-Fueled Bounce
USD/JPY finally tested above the 109.00 level, albeit temporarily. Since then bears have been on attack as prices have peeled all the way below 107.50, leaving a bearish engulfing candlestick on the chart.
USD/JPY Daily Price Chart
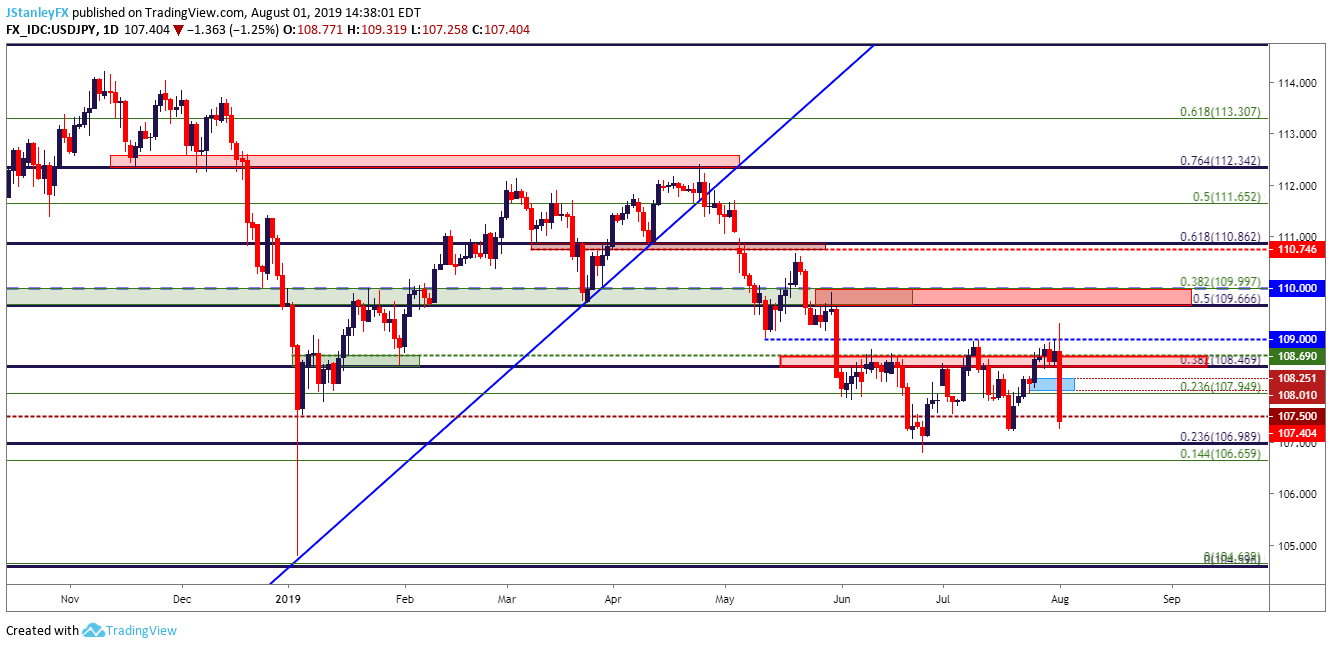
Chart prepared by James Stanley; created with Tradingview (chart link)
Gold Prices Catch Rocket Bid After Tariff Announcement
In an element of inopportune timing, just an hour before this webinar started I published an article asking if a larger pullback was afoot in Gold prices. But, as that tariff announcement came out, Gold prices caught a massive bid to push right back to the 1440 level, so it would look like the answer to the question in my headline is a definitive ‘no.’ Nonetheless, this is still not a move that I’d want to chase as prices are so far away from current supports and, frankly, justifying topside here could be of challenge outside of aggressive bullish breakout strategies.
Gold Eight-Hour Price Chart

Chart prepared by James Stanley; created with Tradingview (chart link)
To read more:
Are you looking for longer-term analysis on the U.S. Dollar? Our DailyFX Forecasts have a section for each major currency, and we also offer a plethora of resources on Gold or USD-pairs such as EUR/USD, GBP/USD, USD/JPY, AUD/USD. Traders can also stay up with near-term positioning via our IG Client Sentiment Indicator.
Forex Trading Resources
DailyFX offers an abundance of tools, indicators and resources to help traders. For those looking for trading ideas, our IG Client Sentiment shows the positioning of retail traders with actual live trades and positions. Our trading guides bring our DailyFX Quarterly Forecasts and our Top Trading Opportunities; and our real-time news feed has intra-day interactions from the DailyFX team. And if you’re looking for real-time analysis, our DailyFX Webinars offer numerous sessions each week in which you can see how and why we’re looking at what we’re looking at.
If you’re looking for educational information, our New to FX guide is there to help new(er) traders while our Traits of Successful Traders research is built to help sharpen the skill set by focusing on risk and trade management.
--- Written by James Stanley, Strategist for DailyFX.com
Contact and follow James on Twitter: @JStanleyFX


