


The U.S. Dollar Index (DXY) found buyers off substantial support, which now has it geared up to test or attempt to break resistance not far ahead. EURUSD is driving lower towards big levels of support. AUDUSD had a nice set-up to trade lower, but is poised to bounce. USDJPY is building a short-term bear-flag on long-term support.
Technical Highlights:
- Dollar Index (DXY) driving towards resistance
- EURUSD declining into big long-term support
- AUDUSD decline out of pattern has support in focus
- USDJPY bear-flag forming on long-term support
For forecasts and educational guides, check them out on the DailyFX Trading Guides page.
Dollar Index (DXY) driving towards resistance
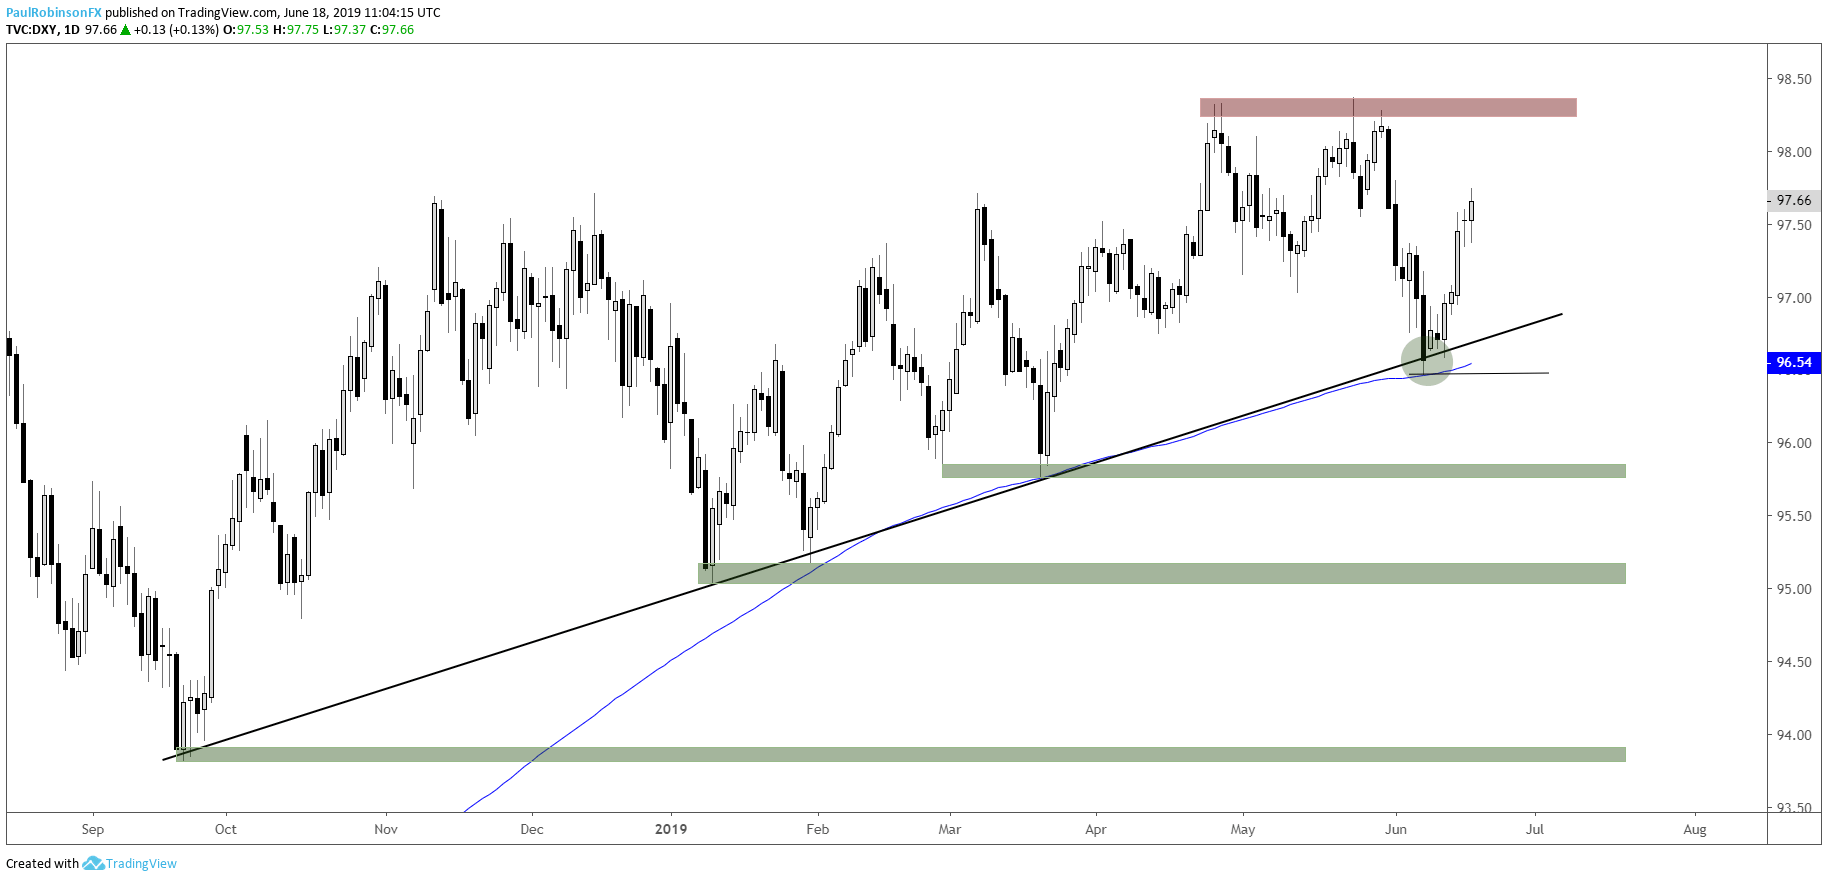
The US Dollar Index (DXY) is continuing to trade higher after shoving off of confluent support last week. This has the area over 98 in focus as resistance, which at this point looks likely to be tested this week. Longer-term the DXY is still stuck inside a broad rising wedge pattern, and it is difficult to say when it will break free from it but the time for a breakout is likely coming up in the next few months at the latest given the pattern’s duration and price proximity to the apex. For now, until a break is sustained the Dollar may continue to bounce around between levels. FOMC tomorrow could certainly jostle things around in the near-term.
US Dollar Index (DXY) Weekly Chart (still inside wedge)

US Dollar Index (DXY) Daily Chart (resistance ahead)
EURUSD declining into big long-term support
The Euro once again failed to sustain a rally, and on that it is heading towards another run at the area just above 11100. It’s a thick spot of support so it would be unsurprising to see a turnaround take place there. That has been the name of the game when trading EURUSD, small swings have to be booked once price runs into a level whether minor or major.
EURUSD Daily Chart (support lies below)

AUDUSD decline out of pattern has support in focus
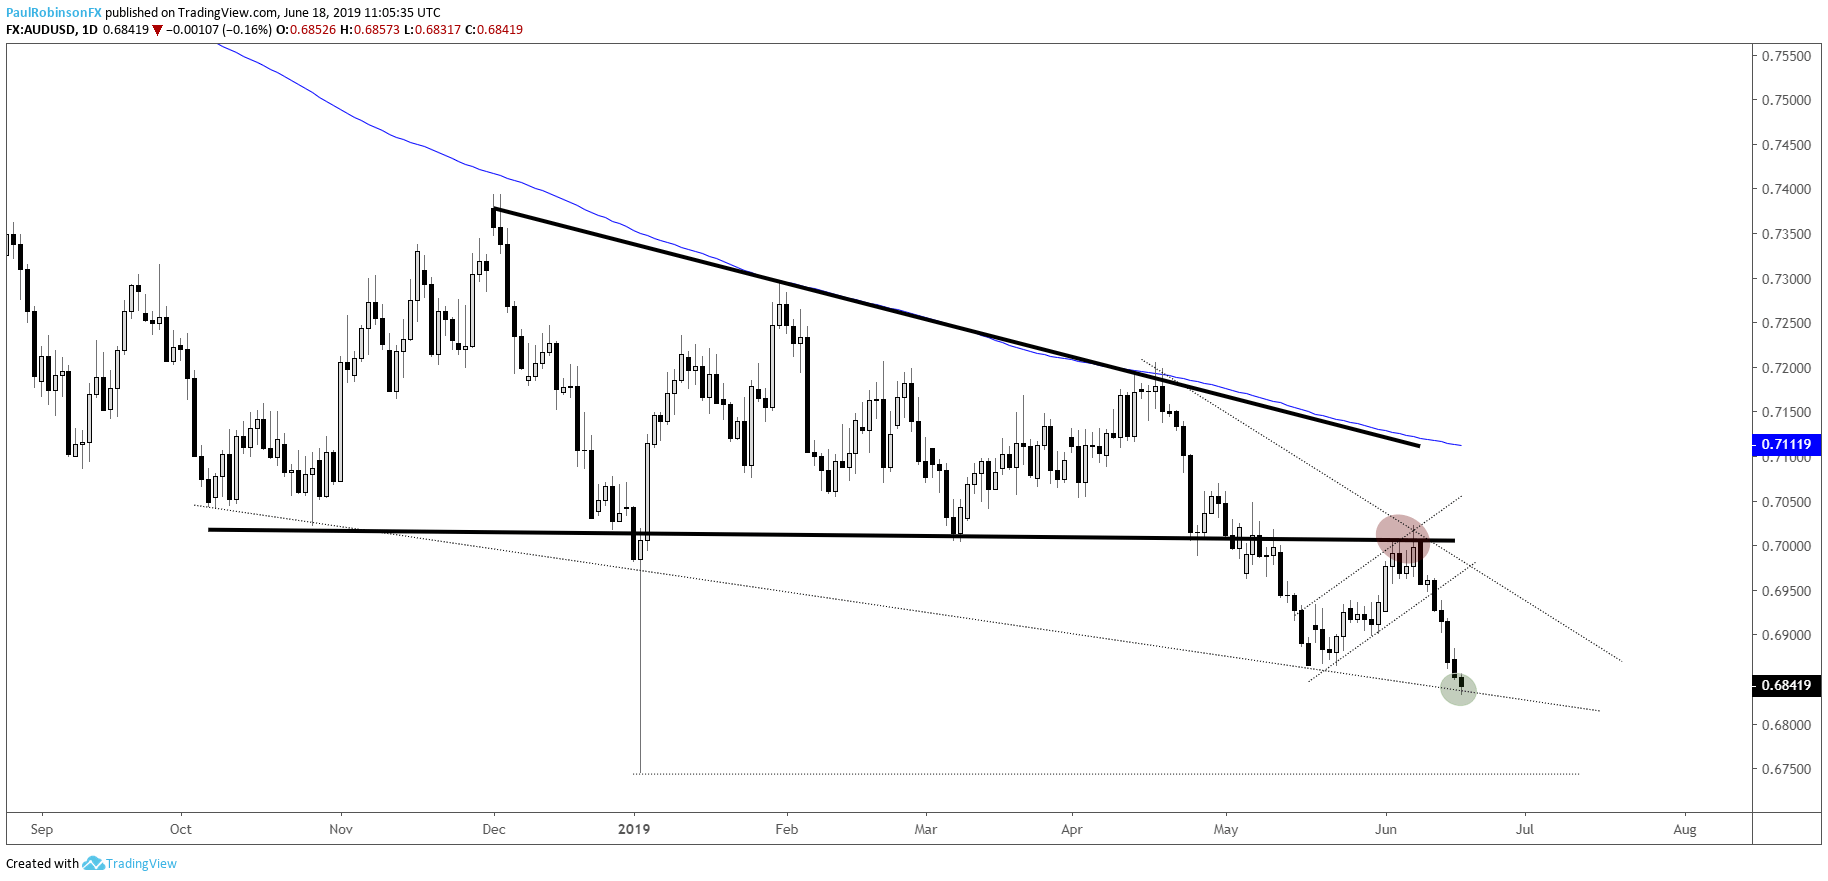
Aussie had a nice set-up we looked at last week, where it successfully rejected the bottom of a longer-term descending wedge and then confirmed a bear-flag. The swing to a new cycle low has an underside trend-line from October in play. This could be enough to induce a small bounce. How price action unfolds on any bounce that ensues will be watched closely as another short trade may set up again.
AUDUSD Daily Chart (may bounce off underside trend-line)
USDJPY bear-flag forming on long-term support
USDJPY is sitting on the bottom of a triangle pattern dating back to June 2016. The three-year pattern suggests a major breakout could be in store at some point in the months ahead. There is a short-term bear-flag forming on top of the lower trend-line of the triangle, which could break USDJPY. However, it’s a long-term level and even though the short-term pattern could trigger it may not be long before a reversal takes shape to keep the triangle intact.
Shorts taken off a bear-flag break would be prudent to be cautious out of the gate for this reason. If a sustained break develops then we could be on the verge of a big move. However, if USDJPY reverses higher here soon then the contracting pattern will remains intact and we’ll have to wait for another time for a meaningful breakout, up or down.
USDJPY Weekly Chart (bottom of long-term triangle)

USDJPY Daily Chart (bear-flag)

Resources for Forex & CFD Traders
Whether you are a new or an experienced trader, DailyFX has several resources available to help you; indicator for tracking trader sentiment, quarterly trading forecasts, analytical and educational webinars held daily, trading guides to help you improve trading performance, and one specifically for those who are new to forex.
---Written by Paul Robinson, Market Analyst
You can follow Paul on Twitter at @PaulRobinsonFX


