


The US Dollar Index (DXY) is probing support lines which need to hold to keep the outlook for USD neutral to bullish. The Euro is pressing up against the upper boundaries of resistance, at a sort of make-or-break point which will have big sway on the DXY. AUDUSD is at big-picture wedge resistance and could be working on a short-term bearish pattern. Gold is trading near some pretty big long-term levels, what it does next could be significant for its broader outlook.
Technical Highlights:
- US Dollar Index (DXY) probing support lines
- EURUSD at upper-end of resistance zone
- AUDUSD at resistance, short-term pattern to watch
- Gold trading near multi-year resistance
See where our team of analysts see your favorite markets and currencies headed in the in the DailyFX Trading Forecasts.
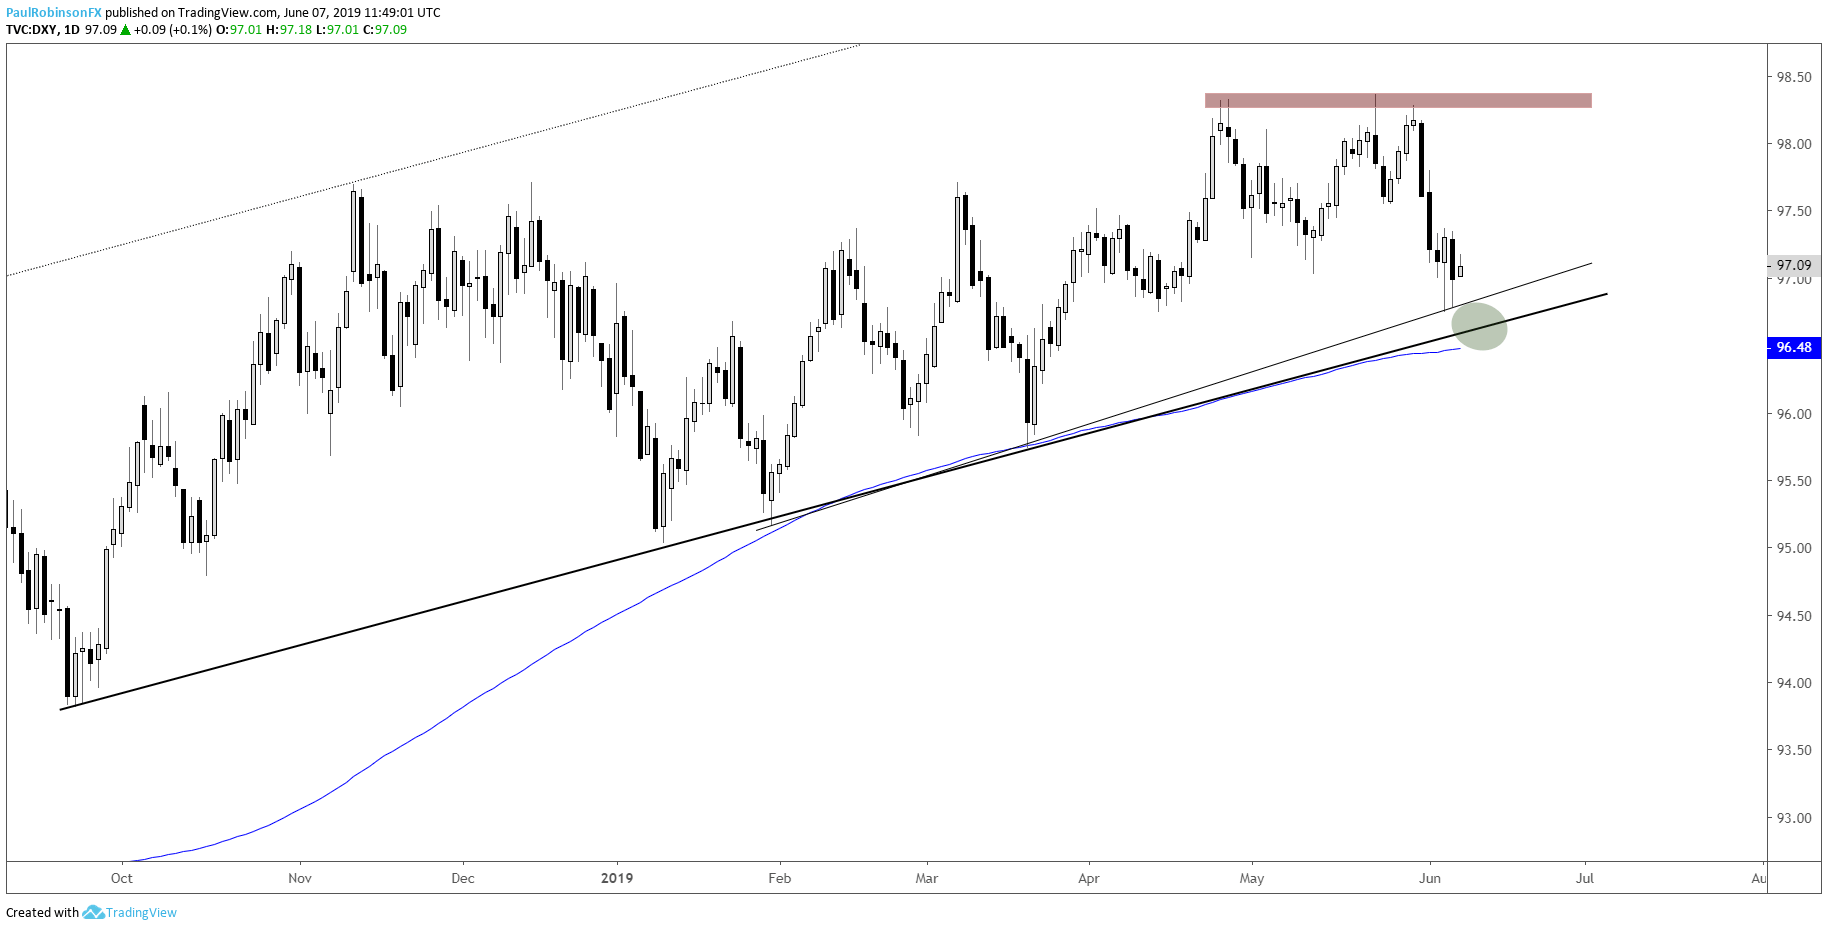
US Dollar Index (DXY) probing support lines
The US Dollar Index (DXY) has been pressing down on support the past couple of sessions, but could still delve deeper into a trend-line, 200-day combo soon. It is preferred from a ‘test the market’s resolve’ standpoint that a deeper test takes place. A larger test and pass or fail could offer up a strong backdrop for the next swing in the Dollar. With where we are on the chart next week could be a good one…
US Dollar Index (DXY) Daily Chart (building a wedge)
Find out where our analysts see the Dollar heading in the coming weeks based on both fundamental and technical factors – Q2 Dollar Forecast
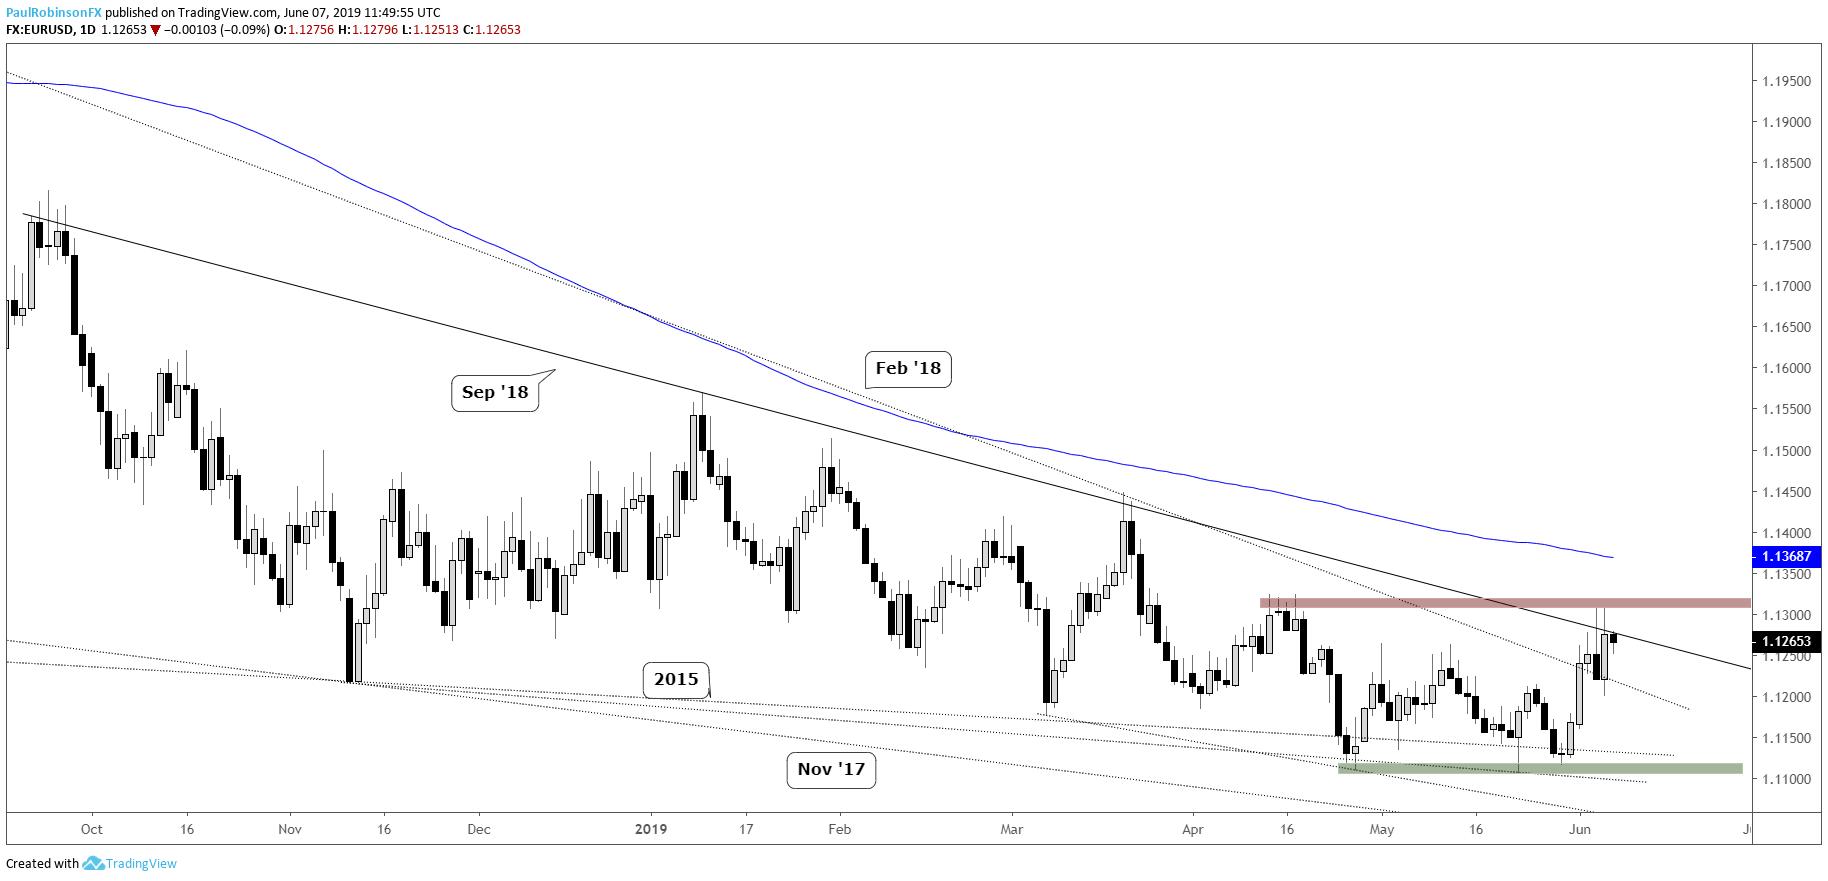
EURUSD at upper-end of resistance zone
The Euro holds the DXY hostage here as it presses up against resistance. The single currency had a strong reversal on Wednesday which was mostly negated yesterday. But this still leaves EURUSD up against some solid trend resistance, price levels around 11320.
Bigger picture the grind has been long and persistent and while the market owes us nothing, the Euro is due for a sustained break in either direction. A strong push above the September trend-line into the mid-11330s may do the trick. If not, then look for a move lower to keep the Euro confined to a range until another attempt can be made on the lows near 11100 or back higher through the aforementioned resistance.
EURUSD Daily Chart (at resistance)
Find out where our analysts see the Euroheading in the coming weeks based on both fundamental and technical factors – Q2 Euro Forecast
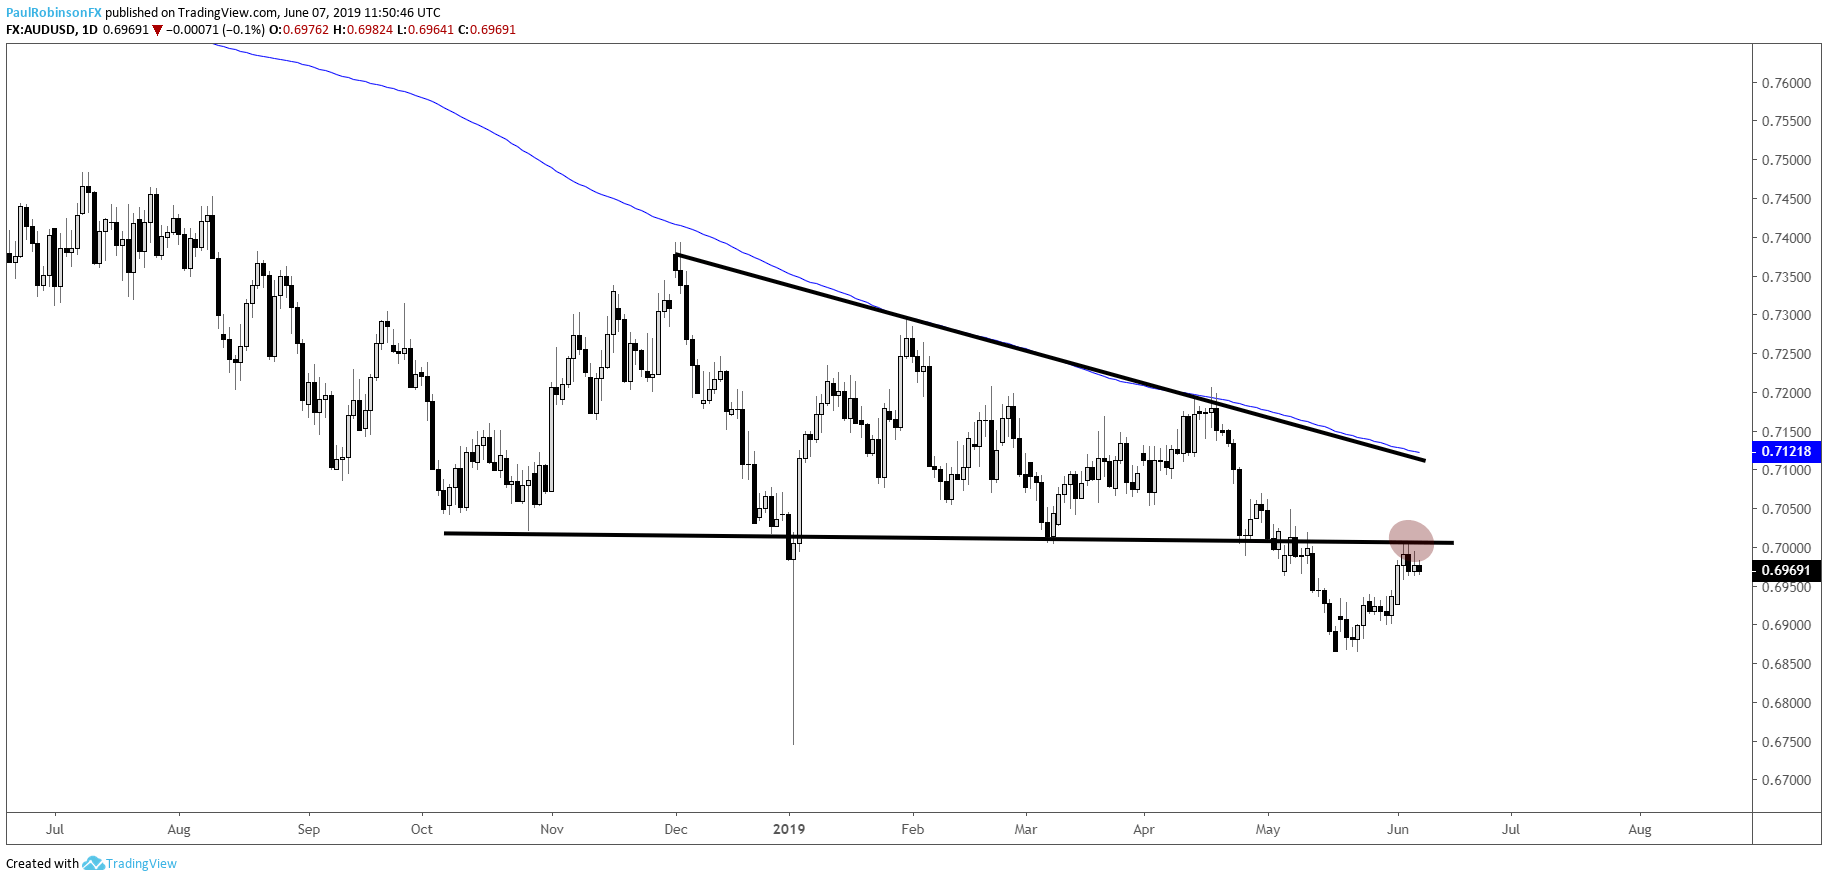
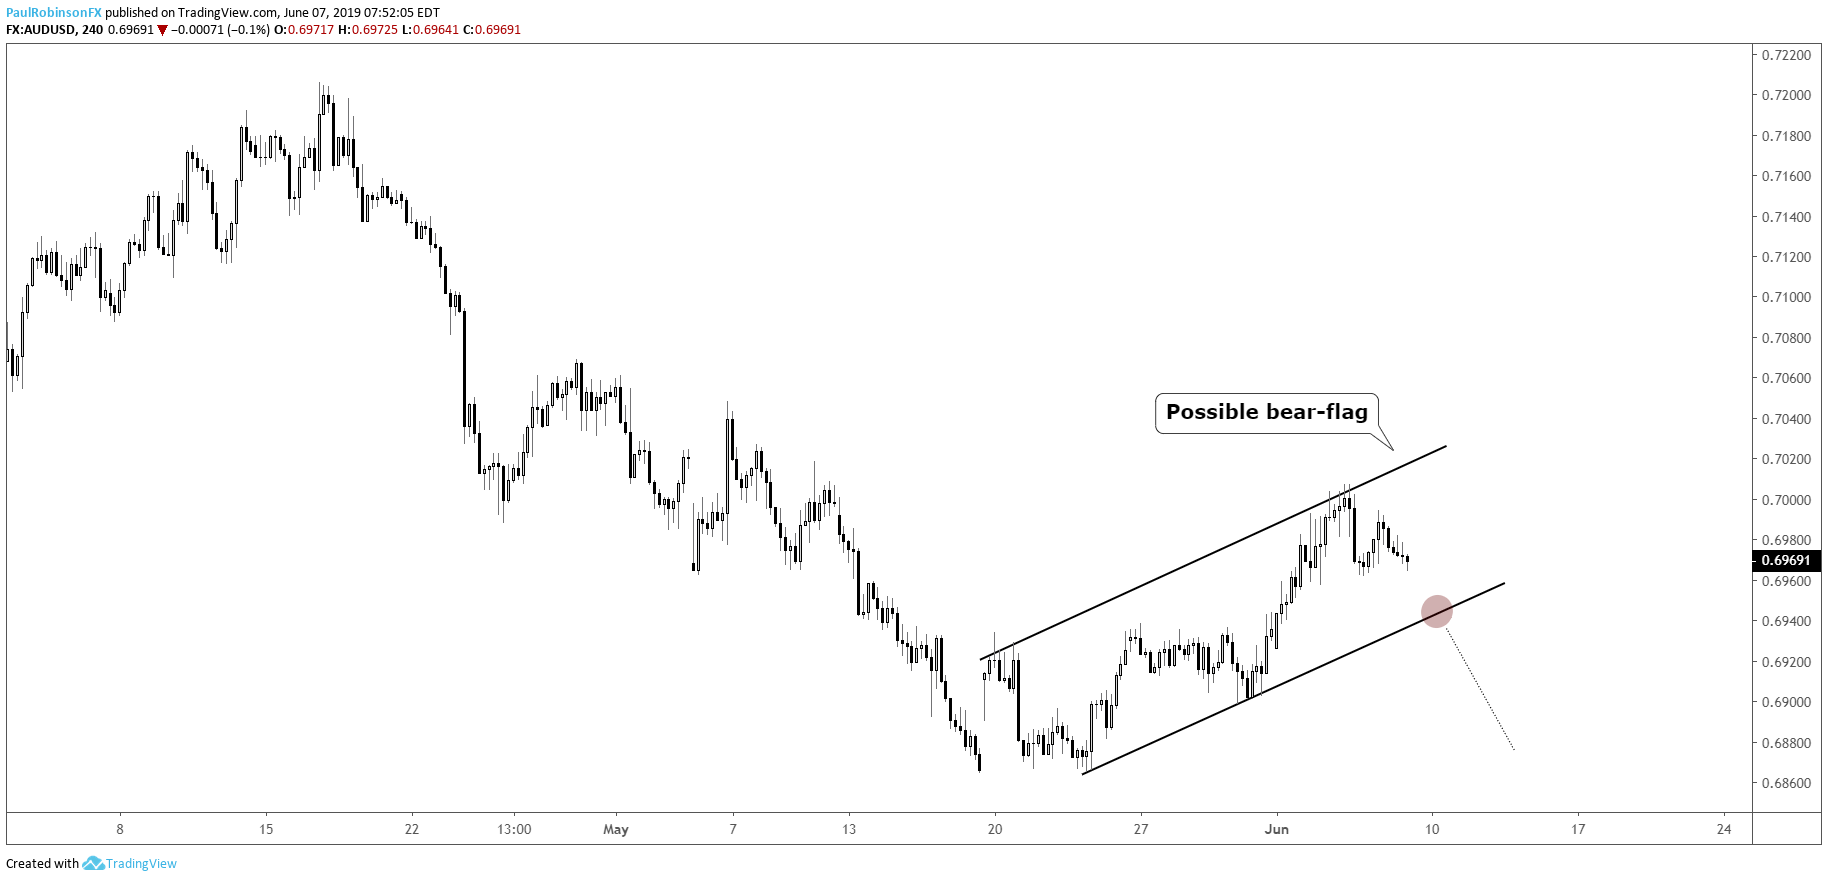
AUDUSD at resistance, short-term pattern to watch
AUDUSD has a couple of noteworthy technical events to watch. Longer-term, it is testing the bottom of the descending wedge it broke a few weeks back. A successful hold below resistance may then go on to help form a well-defined bear-flag on the 4-hr chart.
A break of the flag to the downside will be required to kick Aussie lower, but the rejection at resistance and breakdown from a short-term pattern could make for an attractive trade in the not-too-distant future.
AUDUSD Daily Chart (wedge retest)
AUDUSD 4-hr Chart (bear-flag building?)
Find out where our analysts see the Pound heading in the coming weeks based on both fundamental and technical factors – Q2 Pound Forecast
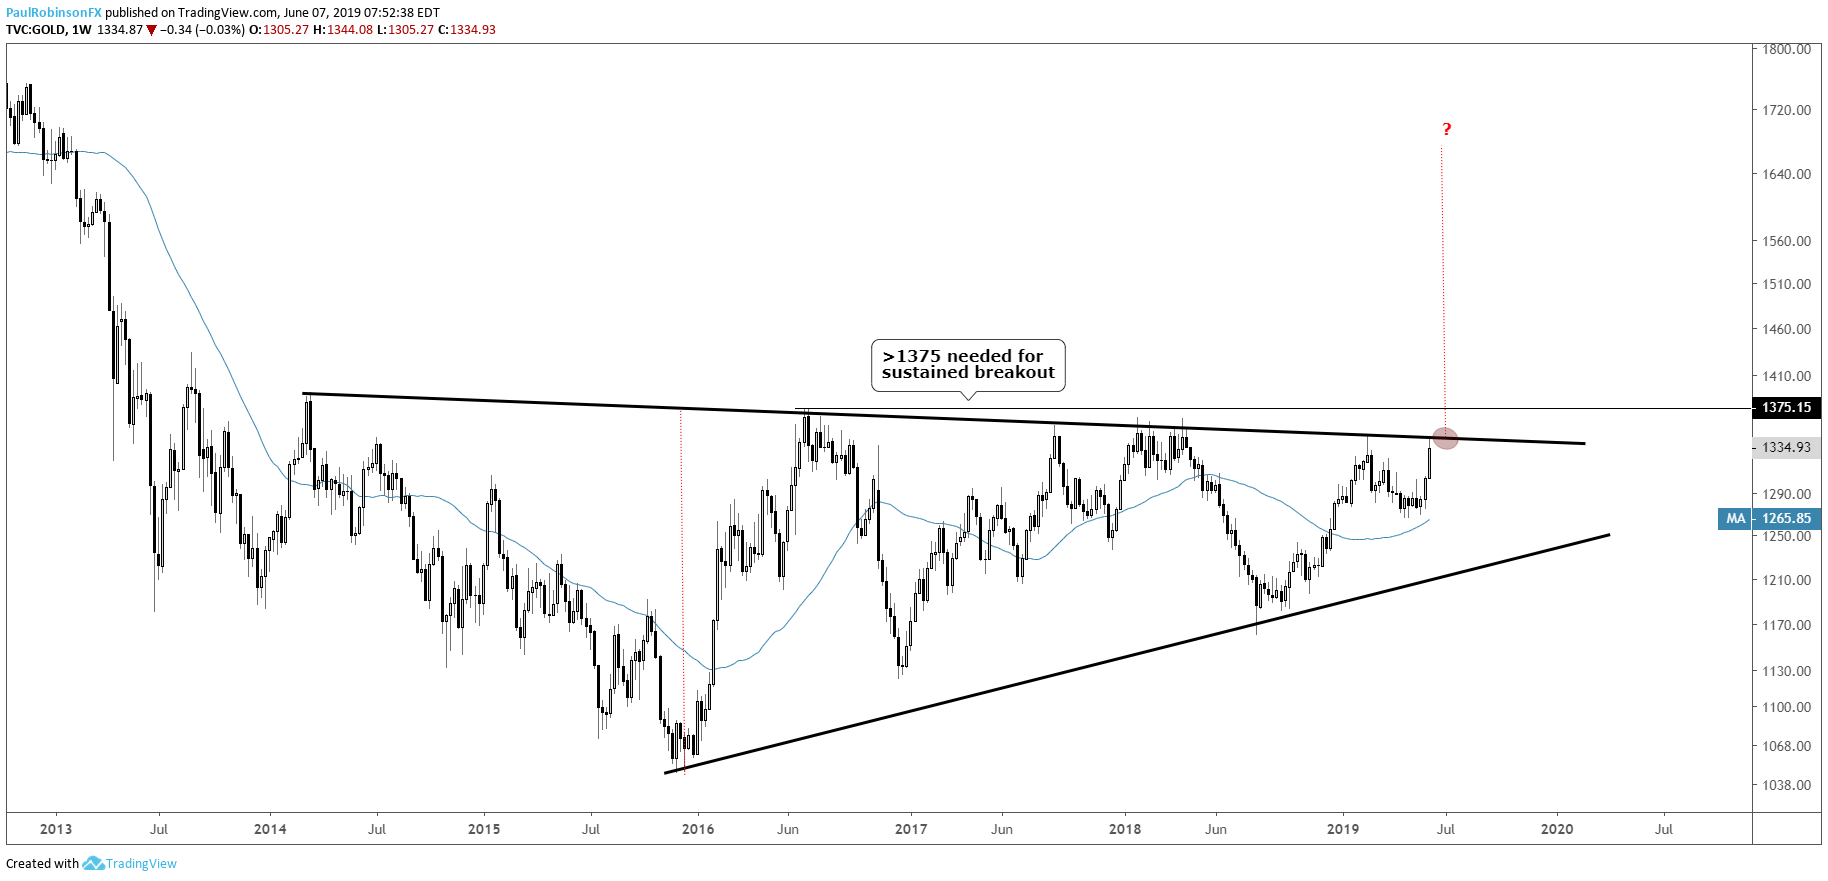
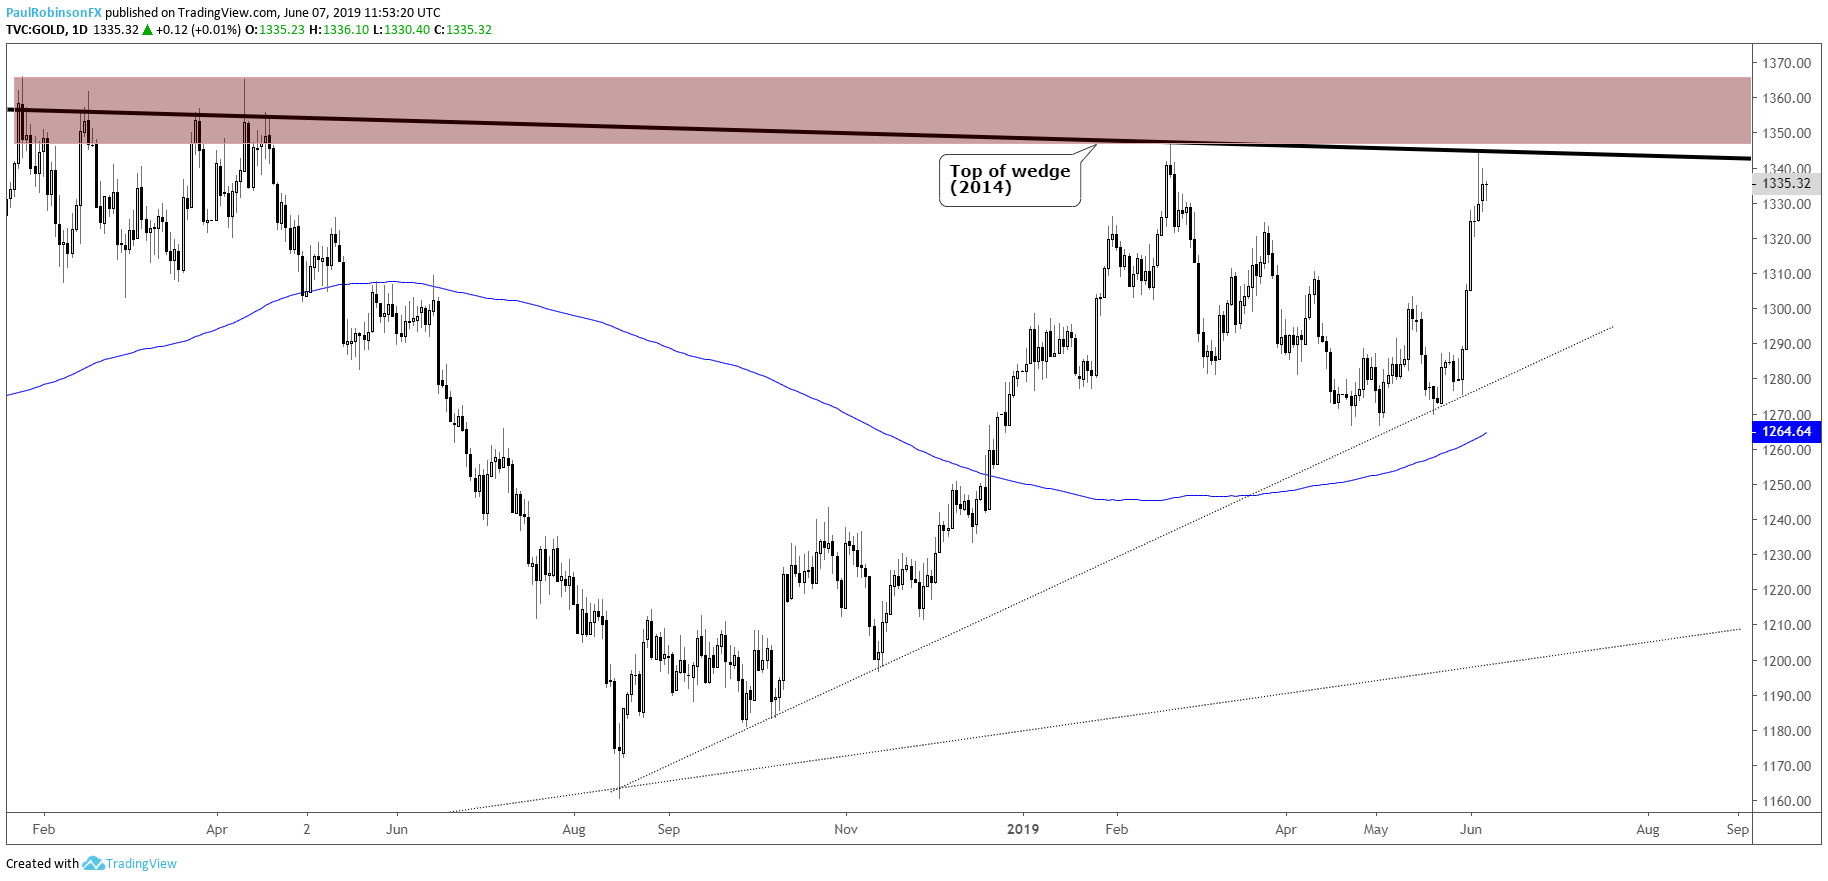
Gold trading near multi-year resistance
Gold is at a major spot on the weekly chart, the top of a broad wedge dating back years. It has a good distance yet to go for a confirmed breakout (1375+) but if it does cross over it could certainly make for a major move higher. But before all of that we must respect resistance.
The other day a solid reversal bar was put in, but we may see some more testing of resistance before a turn down can develop. It’s on the radar and should we see more bearish price action around current levels up to the mid-1360s, then a clean short set-up may present itself.
Find out where our analysts see Gold heading in the coming weeks based on both fundamental and technical factors – Q2 Gold Forecast
Gold Weekly Chart (top of wedge)
Gold Daily Chart (watching for bearish price action)
Resources for Forex & CFD Traders
Whether you are a new or an experienced trader, DailyFX has several resources available to help you; indicator for tracking trader sentiment, quarterly trading forecasts, analytical and educational webinars held daily, trading guides to help you improve trading performance, and one specifically for those who are new to forex.
---Written by Paul Robinson, Market Analyst
You can follow Paul on Twitter at @PaulRobinsonFX


