


The U.S. Dollar has taken a sudden turn for the worst, big support levels starting to come into play. The Euro is largely responsible for the DXY’s sudden shift, but still has headwinds it faces. GBPUSD is trying to trade off a major trend-line dating back to 2016, but still struggling to find buying interest. Gold has exploded in the past few sessions, bringing the top of a macro-wedge pattern into view again.
Technical Highlights:
- Dollar Index (DXY) pressing down on support
- EURUSD trying to take it to the next levels
- GBPUSD in a fight at 2016 trend-line
- Gold rate surging towards long-term levels
Fresh Q2 Forecasts are out for major markets and currencies. Check them out on the DailyFX Trading Guides page.
Dollar Index (DXY) pressing down on support
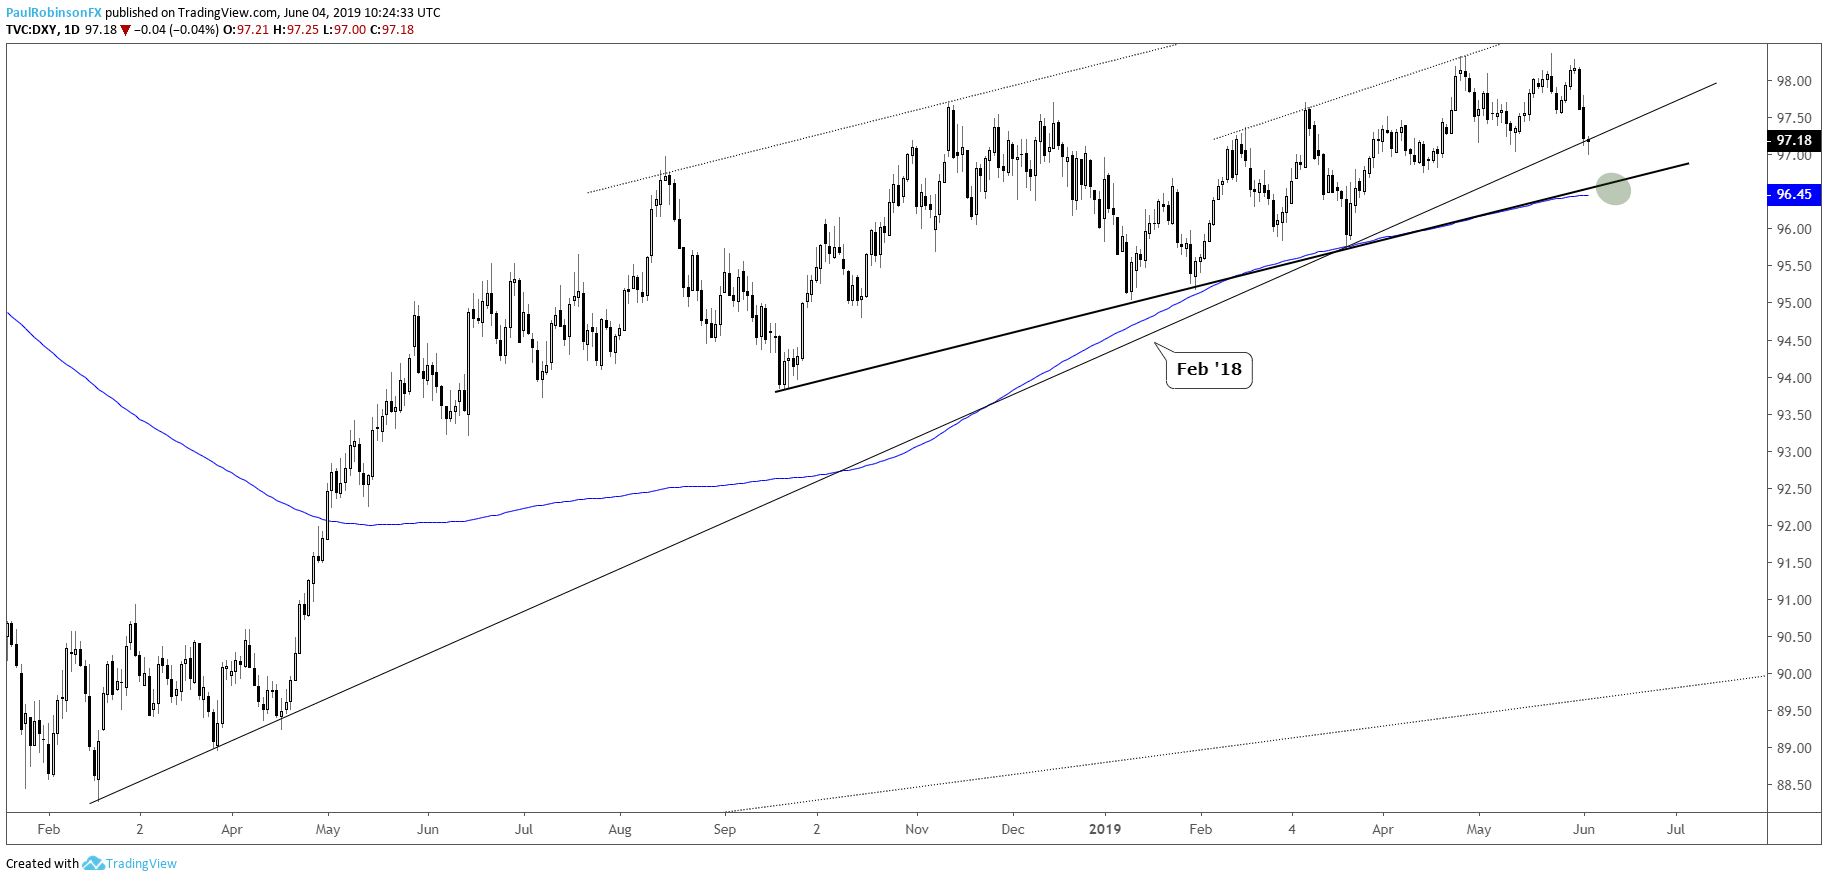
The US Dollar Index (DXY) suddenly took a turn for the worst after looking like it wanted to make good on a breakout to 2-year highs. This has the trend-line from February 2018 currently in focus as support. A hold here keeps it in-line to still to trade higher, but if not then the next level of support comes by way of a slope and 200-day combo that may be even more important for the Dollar’s bigger picture outlook. The slope running over from September is quite steady and with the long-term MA in confluence, it could provide a pivotal make-or-break spot.
US Dollar Index (DXY) Daily Chart (2018 t-lines, then 200-day combo)
Find out where our analysts see USD heading in the coming weeks based on both fundamental and technical factors – Q2 USD Forecast
EURUSD trying to take it to the next levels
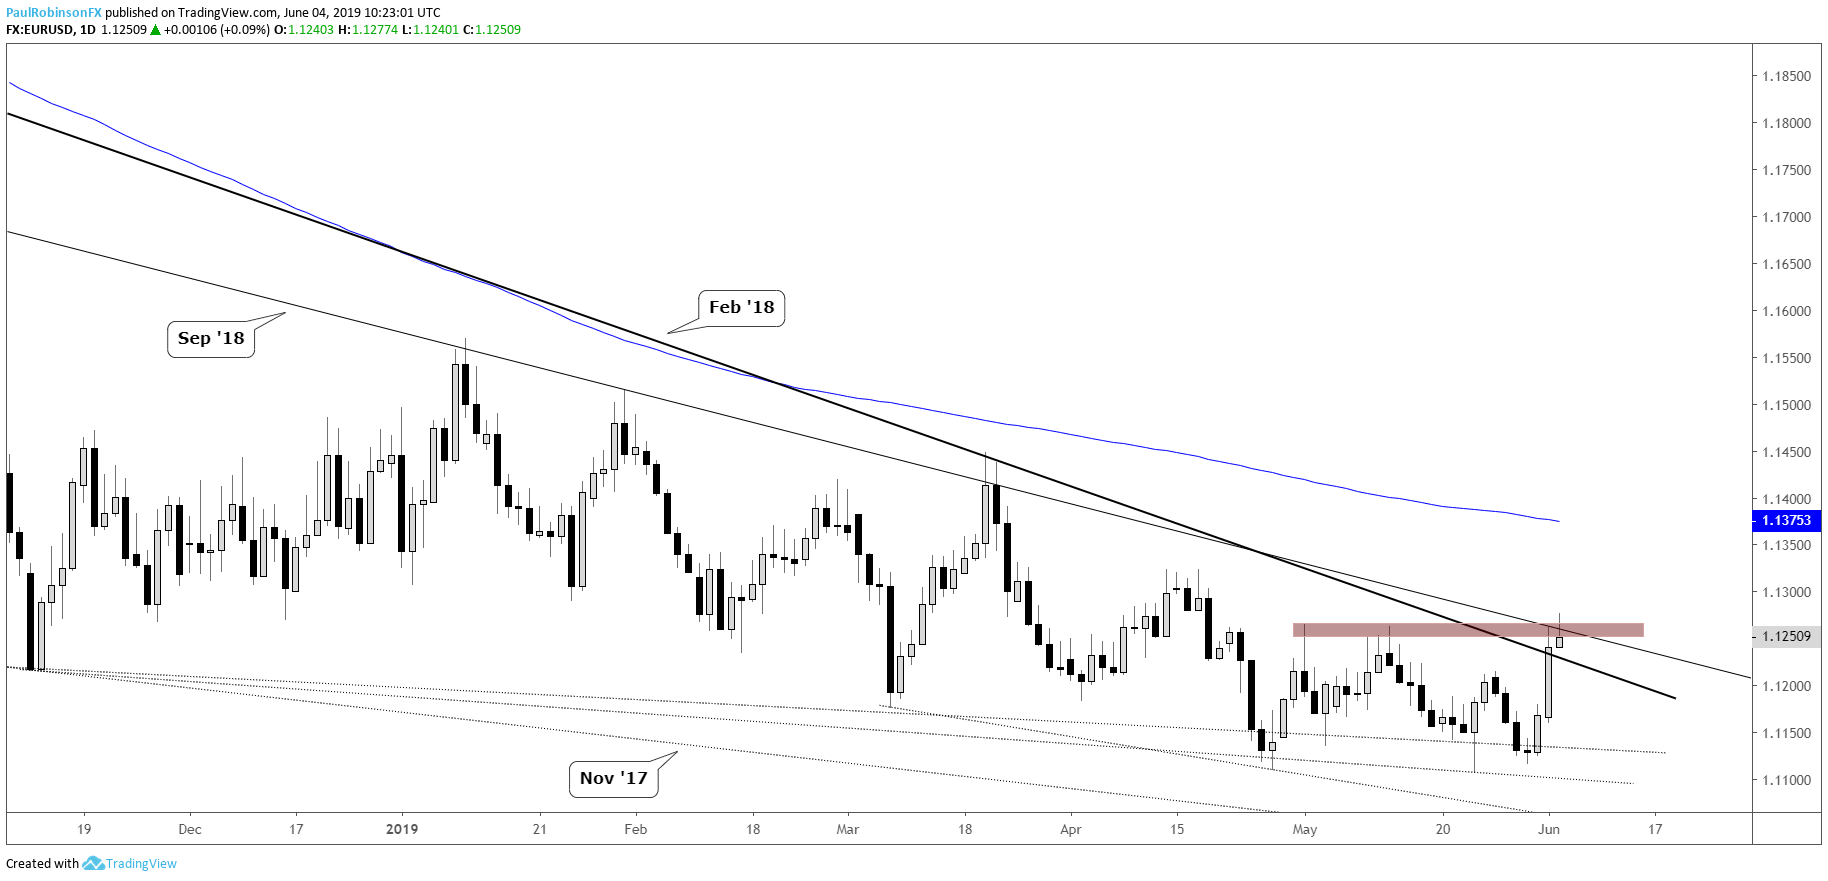
The Euro’s sudden surge is primarily responsible for the DXY’s suddenly rocking back on its heels. It is currently sneaking above the Feb ’18 trend-line, but has a slope running down from September as well that is helping keep a lid on the single-currency.
A reversal off trend resistance will be closely watched as any strength in recent months has been quickly reversed, and that could turn out to be the case once again. A sustained move above both of these thresholds could quickly bring into play the 200-day at 11375.
EURUSD Daily Chart (pushing above Feb ’18 t-line)
Find out where our analysts see the Euro heading in the coming weeks based on both fundamental and technical factors – Q2 EUR Forecast
GBPUSD in a fight at 2016 trend-line
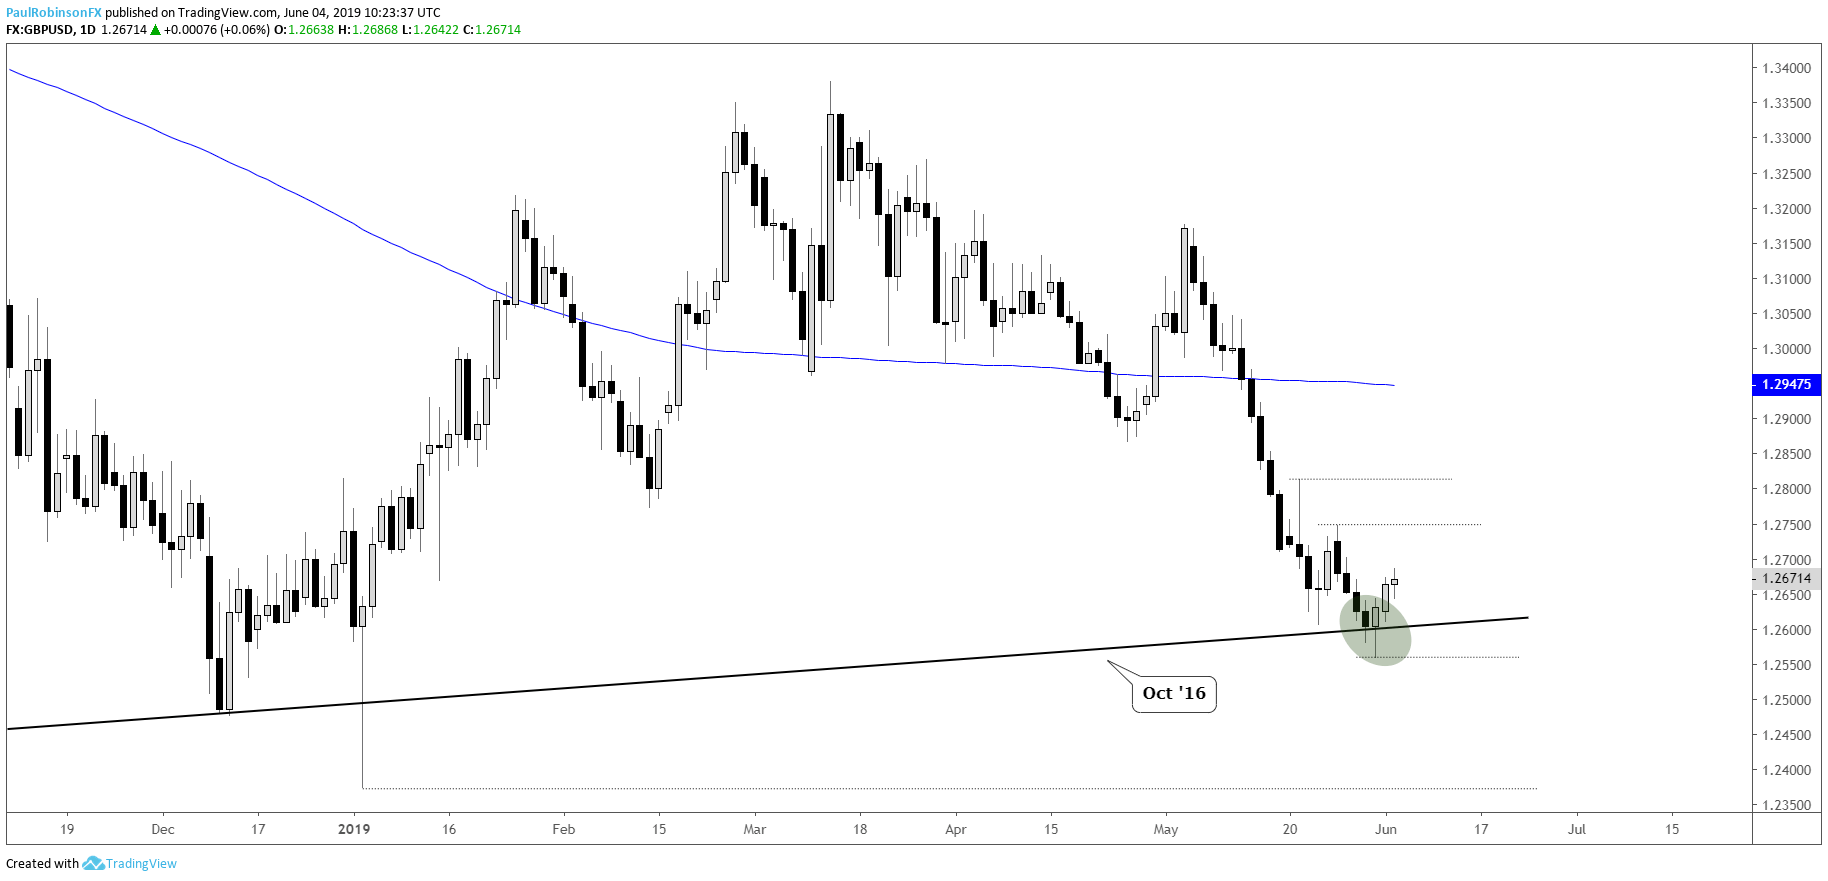
I looked at GBPUSD over the weekend for this week’s technical forecast, and the primary focus was on the trend-line dating back to the October 2016 flash-crash low. Friday saw a minor reversal off this threshold and as long as it holds we must respect it as support. The push has been modest so far, but that could quickly change. First up as resistance on further strength is the May 27 high at 12748. A break below 12559 would likely have Cable rolling back downhill with force again as the long-term trend-line breaks.
GBPUSD Chart (trying to lift off 2016 t-line)
Find out where our analysts see the Pound heading in the coming weeks based on both fundamental and technical factors – Q2 GBP Forecast
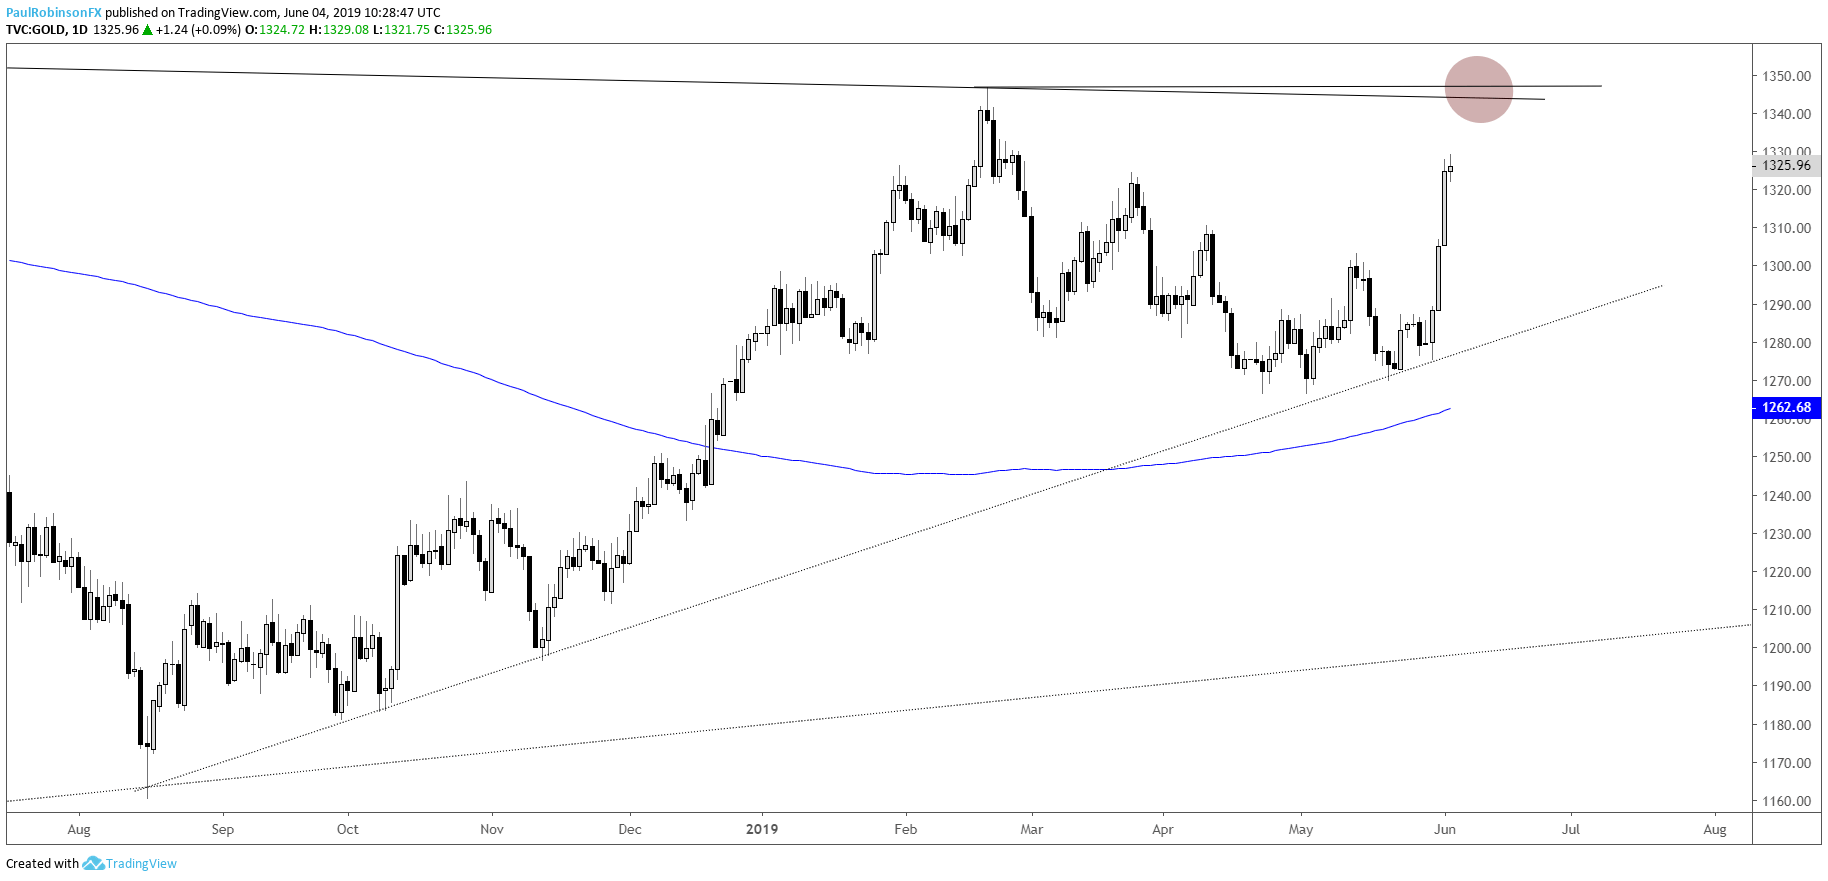
Gold rate surging towards long-term levels
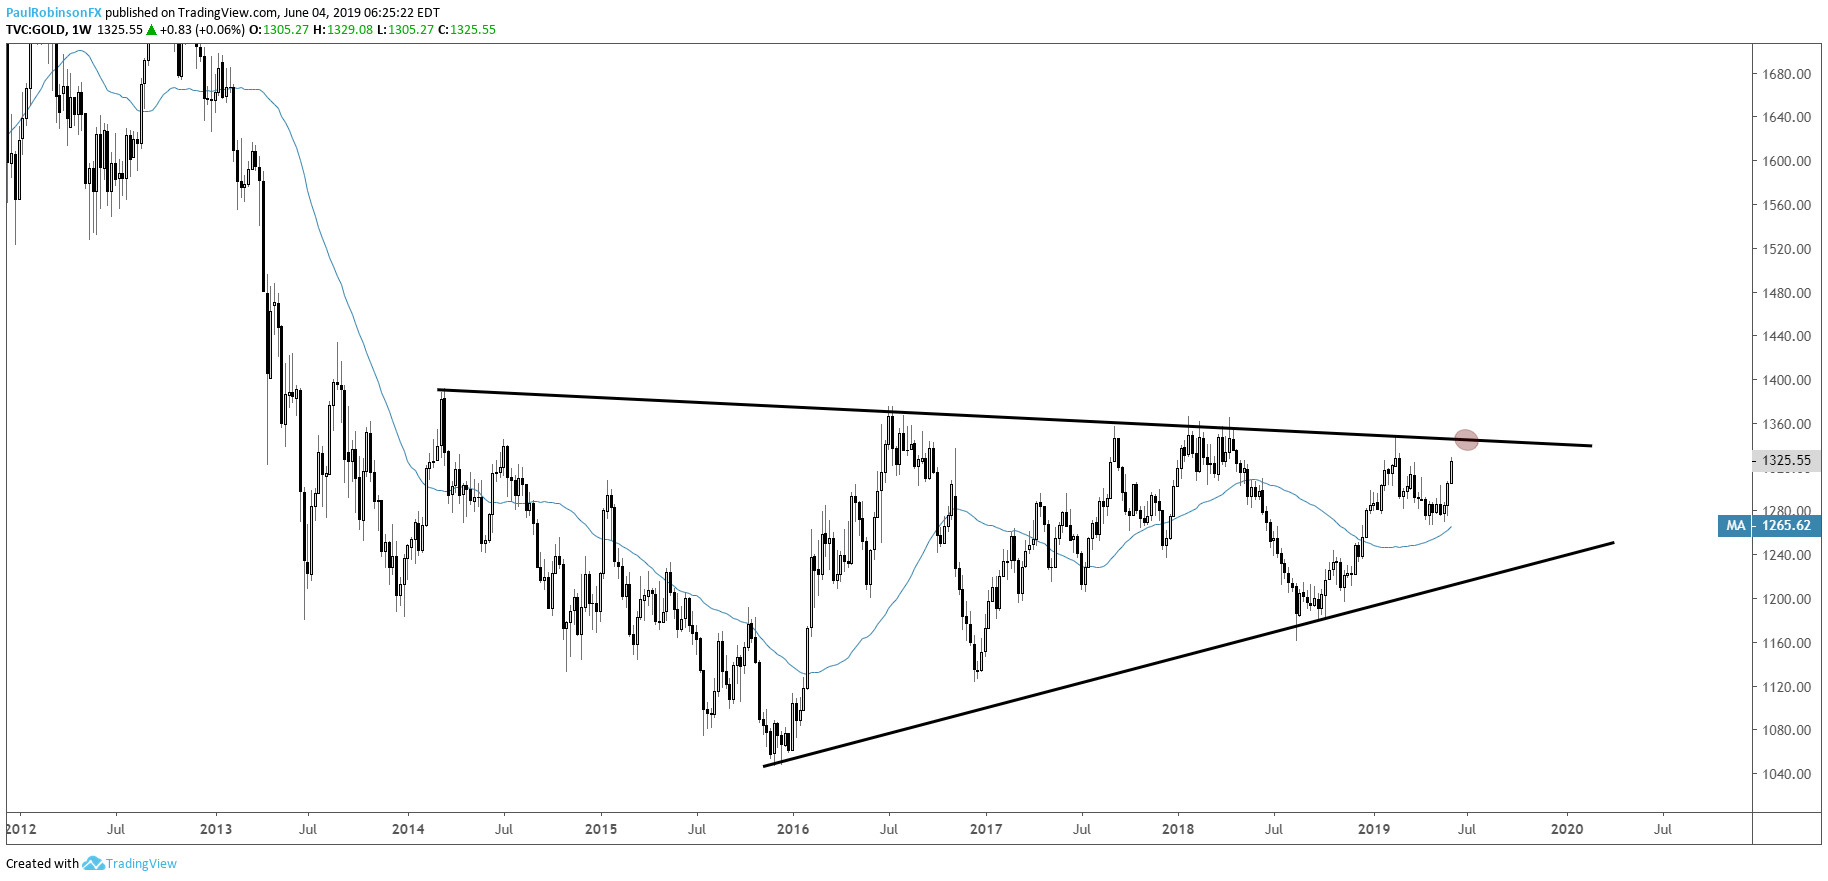
The gold surge off the August trend-line has been strong and surprising. It has another $15-25 to go before some seriously big levels come into play. The top of the wedge dating back to 2014 will soon be a big focal point. How things play out there could determine the technical outlook from a macro-perspective. Initial strength up to the top of the wedge around 1340/55 will be viewed as a spot of potential selling interest.
Gold Rate Weekly Chart (Nearing top of macro-wedge)
Gold Rate Daily Chart (big spot above)
Find out where our analysts see gold heading in the coming weeks based on both fundamental and technical factors – Q2 Gold Forecast
Resources for Forex & CFD Traders
Whether you are a new or an experienced trader, DailyFX has several resources available to help you; indicator for tracking trader sentiment, quarterly trading forecasts, analytical and educational webinars held daily, trading guides to help you improve trading performance, and one specifically for those who are new to forex.
---Written by Paul Robinson, Market Analyst
You can follow Paul on Twitter at @PaulRobinsonFX


