


The silver price outlook is bullish against a backdrop of trend changing towards a weaker US Dollar.
The video above is a recording of a US Opening Bell webinar from May 20, 2019. We focused on the Elliott Wave patterns for key markets such as silver, gold, DAX 30, S&P 500, DXY, EURUSD, and USDJPY.
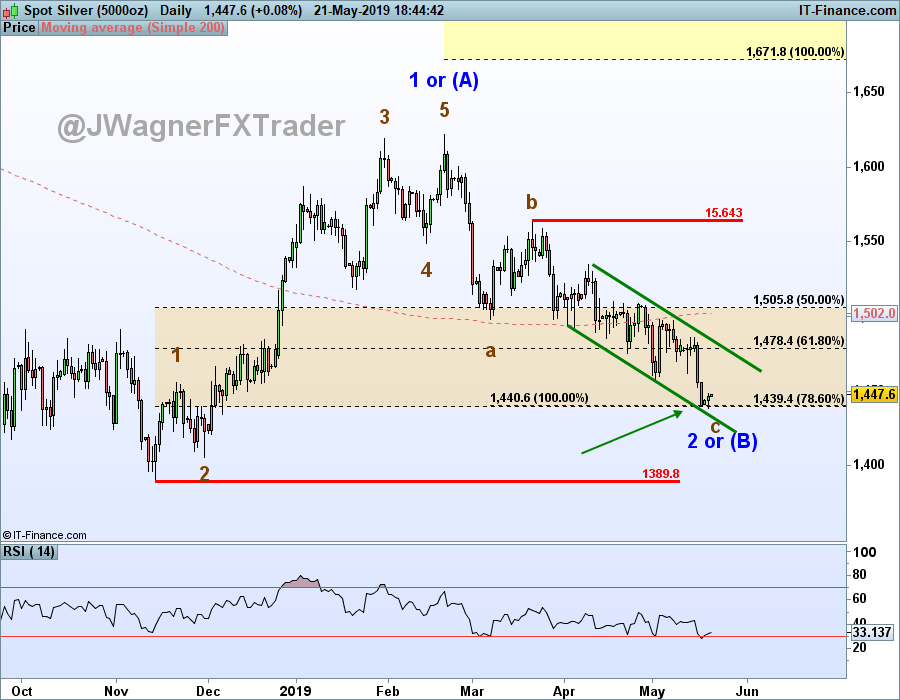
Silver prices hover in bullish reversal zone
Our last silver price update was April 29, when we stated “little progress has been made since April 15 and the waves do not appear motive. Therefore, we will not be surprised if silver makes a deeper cut and one more jab towards lower prices.”
Lower prices were cut indeed. Remember, back on March 25, silver prices were trading near 15.53 and we discussed the potential for another wave lower into the 14.40-14.80 price zone which may lead to a strong bullish reversal. Now that silver prices have arrived, we have the minimum waves in place to count the three-month long correction as over.
You see, the corrective wave to unfold since February 2019 high is a bearish zigzag pattern. Wave ‘c’ of this zigzag pattern is an ending diagonal. There are a lot of wave relationships showing up near 14.40 (which was the bottom edge of our reversal zone identified March 25).
- 78.6% retracement of the November 2018 to February 2019 uptrend is at 14.39
- In the zigzag, wave ‘c’ is equal to the length of wave ‘a’ at 14.40
- The trend line connecting wave (i) and (iii) in the diagonal pattern crosses near 14.40 (green line)
As a result, there is a lot of evidence in a relatively small zone suggesting a bullish reversal and pivot.
When anticipating a reversal in trend, waiting for the new trend to strengthen and push above resistance (in this case) will help shift the likelihood a low has been established. In this case, the green parallel line hovering near 14.75 is the level that if broken, suggests a meaningful low has been established.
Therefore, the current Elliott wave for silver prices is that wave 2 or (B) is nearing a termination point (if it hasn’t ended yet). Once this ending diagonal pattern finalizes, we are anticipating a multi-month bullish wave to carry to 16.70 and possibly 18.15.
Read more…
US Dollar Index Pauses at 98
The recent strength in the US Dollar Index is likely a temporary move of strength. It is a little early in the pattern, but we are following the potential for a bullish ending diagonal pattern. Diagonal patterns are five waves of zigzags or multiple zigzags. It appears we have waves 1 and 2 of the five-wave diagonal in place. If this is correct, then DXY is advancing now in wave 3 of (c). Overall, this is a corrective advance that we eventually expect to be completely retraced.
Some topside targets to keep in mind include 100.40. There are a couple of wave relationships showing up near there. DXY does not need to advance that high so we are in a state of counting the waves until they are completed. If wave 5 of (c) can be counted as complete near 100, then we will be on alert for a large correction for US Dollar that may work down to the low and mid 80’s.
An alternative scenario we are following is that if DXY reverses now, this current high could be wave B of (B) and may only dip to 92-94.
Read more…

Elliott Wave Theory FAQ
How does Elliott Wave theory work?
Elliott Wave theory is a trading study that identifies the highs and lows of price movements on charts via wave patterns. Traders analyze the waves for 5-wave moves and 3-wave corrections to determine where the market is at within the larger pattern. Additionally, the theory maintains three rules and several guidelines on the depth of the waves related to one another. Therefore, it is common to use Fibonacci with Elliott Wave analysis. We cover these topics in our beginners and advanced Elliott Wave trading guides.
After reviewing the guides above, be sure to follow future Elliott Wave articles to see Elliott Wave Theory in action.
---Written by Jeremy Wagner, CEWA-M
Jeremy Wagner is a Certified Elliott Wave Analyst with a Master’s designation. Jeremy provides Elliott Wave analysis on key markets as well as Elliott Wave educational resources. Read more of Jeremy’s Elliott Wave reports via his bio page.
Join Jeremy in his live US Opening Bell webinar where these markets and more are discussed through Elliott wave theory.
Follow Jeremy on Twitter at @JWagnerFXTrader .
Recent Elliott Wave analysis you might be interested in…
S&P 500 Patterns Point to an Eventual December Low Retest


