Crude oil posted a reversal candle for the week last week and a daily reversal yesterday; this positions it to break support. The Dow has yet to reach an all-time high with the S&P 500 and Nasdaq 100, but that could soon change. Gold and silver prices are both positioned to breakout eventually, but have to either cross above or below noted thresholds.
Technical Highlights:
- Crude oil double reversals putting pressure on support
- Dow could soon extend to record highs with other indices
- Gold and silver in limbo, but have defining lines/levels
Make more informed decisions by checking out our trading forecasts and educational resources on the DailyFX Trading Guides page.
Crude oil double reversals putting pressure on support
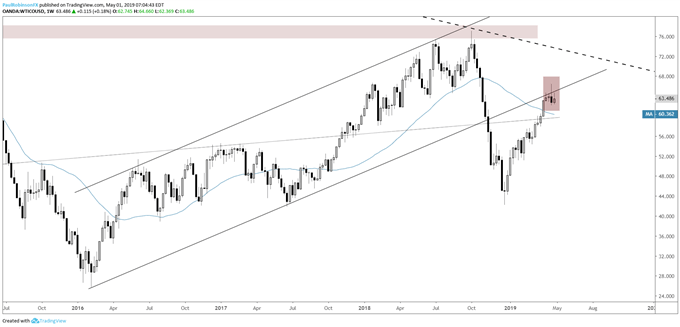
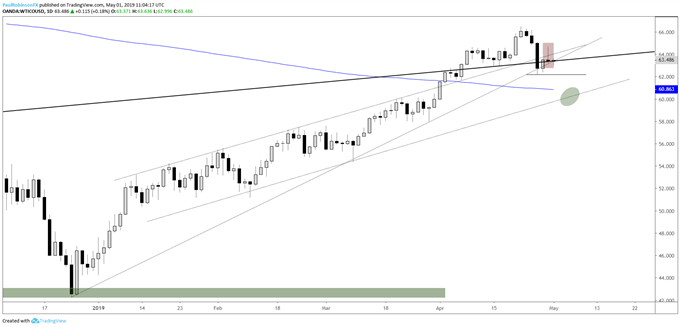
As discussed yesterday, crude oil posted a weekly reversal last week and with the one forming yesterday on the daily, the odds have increased significantly that we will see more weakness soon. These ‘reversal inside reversal’ situations are one of my favorite set-ups. A break below 62.16 should have WTI rolling downhill, while the reversal set-up will be negated on a close above 64.66.
Crude Oil Weekly Chart (reversal around slope)
Crude Oil Daily Chart (reversal puts pressure on support)
Check out the Q2 Crude Oil Forecast for the intermediate-term fundamental and technical outlook.
Dow could soon extend to record highs with other indices
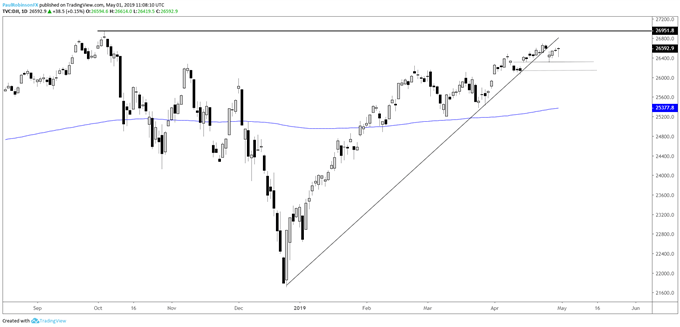
The S&P edged to a record high on the heels of the Nasdaq 100 leading the way, it may soon be the Dow’s turn. It broke a trend-line recently but that didn’t mean a trend turn, necessarily, and with the broader market strong it may be just a matter of time before a new record is seen.
Dow Daily Chart (push to high coming?)
Check out the Q2 Equities Forecast for the intermediate-term fundamental and technical outlook.
Gold and silver in limbo, but have defining lines/levels
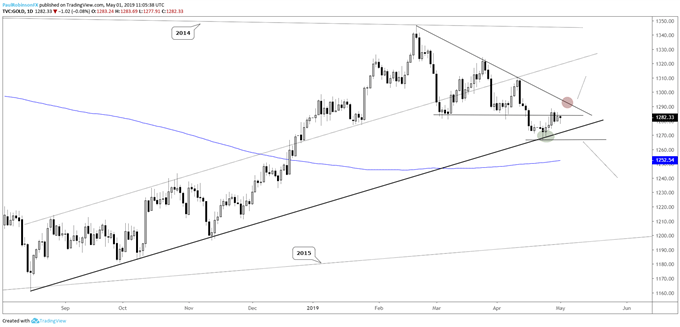
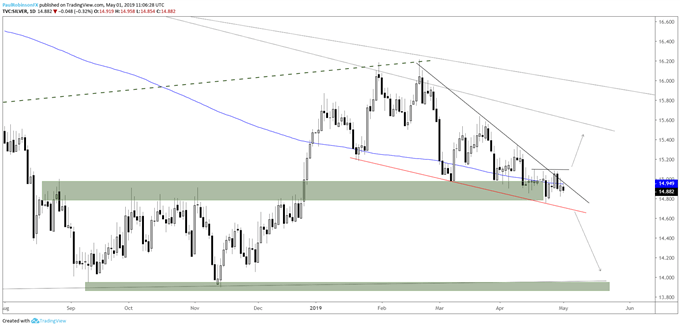
Gold is still sitting in a somewhat bearish manner but needs to break the August trend-line and 1266 to trade off further. On the top-side, the February trend-line needs to be breached to turned things neutral to bullish. Silver is near the apex of a falling wedge and with that it is nearing a breakout point. A cross above the top-side trend-line of the pattern and 15.10 is needed for a bullish breakout, while a decline below the lower trend-line and 14.65 is needed for a bearish breakdown.
Gold Price Daily Chart (lines to watch)
Silver Daily Chart (breakdown(out) levels to watch)
Check out the Q2 Gold Forecast for the intermediate-term fundamental and technical outlook.
Resources for Index & Commodity Traders
Whether you are a new or an experienced trader, DailyFX has several resources available to help you; indicator for tracking trader sentiment, quarterly trading forecasts, analytical and educational webinars held daily, and trading guides to help you improve trading performance.
We also have a series of guides for those looking to trade specific markets, such as the S&P 500, Dow, DAX, gold, silver, crude oil, and copper.
---Written by Paul Robinson, Market Analyst
You can follow Paul on Twitter at @PaulRobinsonFX


