


US Dollar, Gold, EUR/USD Talking Points:
- If you’re looking to improve your trading approach, our Traits of Successful Traders research could help. This is based on research derived from actual results from real traders, and this is available to any trader completely free-of-charge.
- If you’re looking for a primer on the FX market, we can help. To get a ground-up explanation behind the Forex market, please click here to access our New to FX Trading Guide.
If you’d like to sign up for our webinars, we host an event on Tuesday and Thursday, each of which can be accessed from the below links:
Tuesday: Tuesday, 1PM ET
Thursday: Thursday 1PM ET
US Dollar Breaks Out From Ascending Wedge – Gold Price Gains Go Along
The US Dollar has finally broken out of the ascending wedge formation that’s been brewing since last year. But, now the natural next question for traders: What’s next?
At this point, the bullish theme in USD has aim for continuation, but in deciphering that, it’s important to dial back to the question of drivers. As in, what created this swell of strength in the US Dollar that’s finally allowed for bearish breakouts to show in key pairs like EUR/USD and GBP/USD? There wasn’t any particularly strong US data that did the pushing, nor did this come from FOMC verbiage. Making matters a bit more interesting is the fact that USD-strength showed-up along with stronger Gold prices and a show of strength in the Japanese Yen, all factors that would point to the potential for risk aversion. In this webinar, I looked through major currency pairs to attempt to dial in to the most pressing themes across macro markets.
US Dollar Breakout Crosses Key Terrain
Yesterday’s breakout in USD saw the pair take-out the 97.70 level that had made up resistance in the ascending triangle formation, and bulls continued to push. The 98-level was soon in-play, where exists a couple of longer-term Fibonacci levels, but even that couldn’t slow down the advance as buyers pushed all the way until a high was set at 98.32. This can make for a difficult time to chase that fresh breakout, especially considering that today’s non-completed Daily bar is showing as a spinning top or a possible Doji.
US Dollar Price – Daily Chart
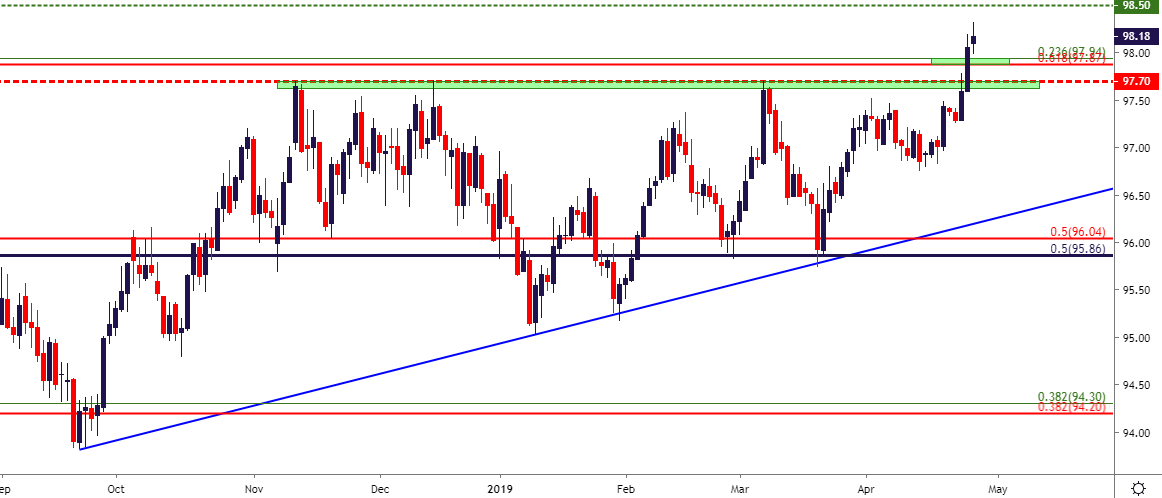
Chart prepared by James Stanley
This can keep the door open for higher-low support. The area around prior resistance of 97.70 becomes an obvious area to follow. And just above that, around 98, is another potential support zone as taken from two Fibonacci levels.
US Dollar Price Chart – Hourly
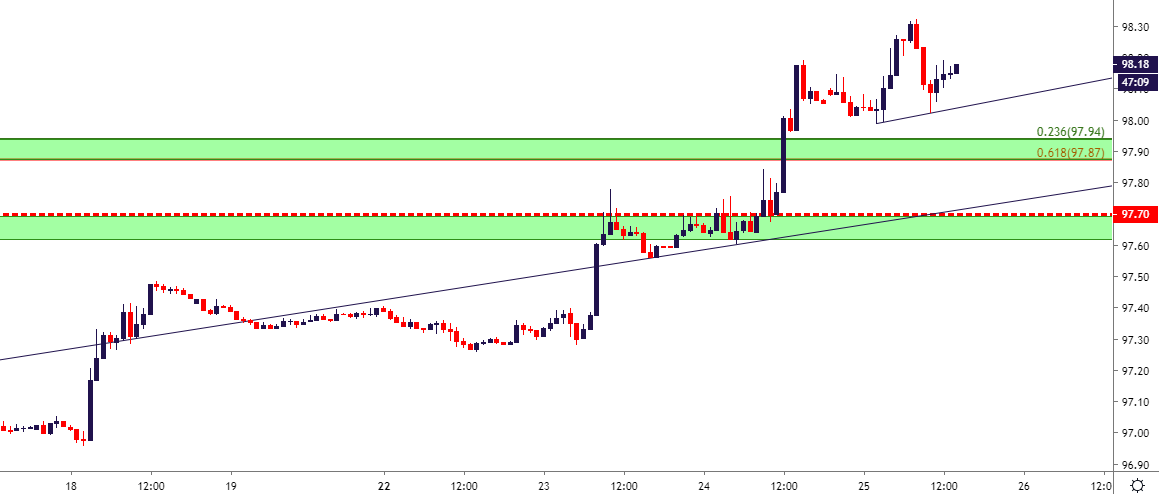
Chart prepared by James Stanley
Gold Price Bounces Along with US Dollar Strength
The week started with continued selling in Gold prices, and that theme ran all the way until a bullish trend-line came into play around the 1266 level. That has since helped to hold support, and as the US Dollar breakout started to take-hold yesterday, Gold prices continued to rally from that low.
Gold Price Daily Chart
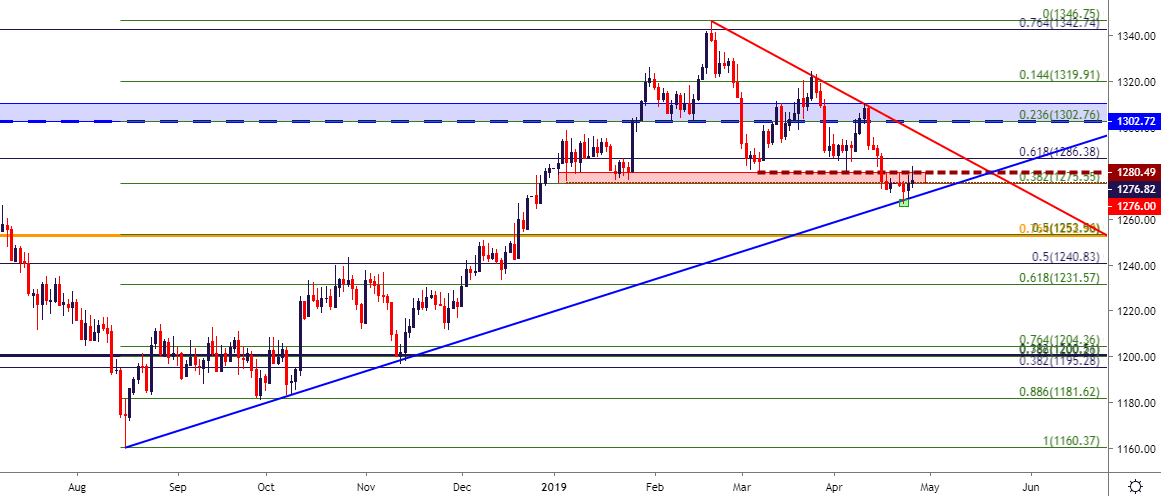
As of this morning, Gold prices were testing short-term resistance around prior support. This zone runs from 1275.55-1286.38, and this area had previously held up the 2019 lows as a descending triangle formation was building earlier this month. As looked at in the webinar, buyers are now making a forward push to re-claim that support zone, and the fact that this was taking place amidst a backdrop of USD-strength may be saying something.
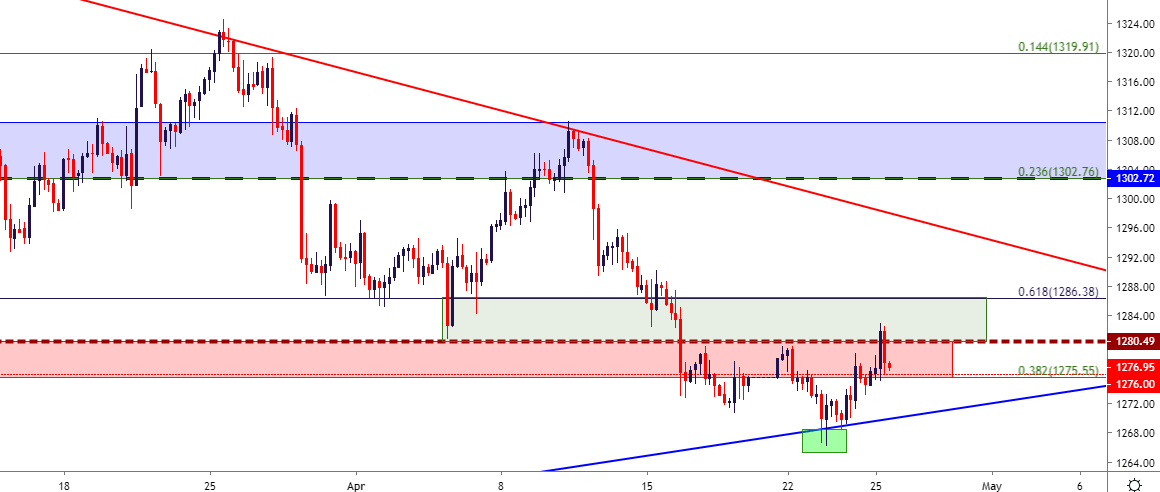
Gold Price Four-Hour Chart
EUR/USD Bounces from 1.1120, Can Bears Continue to Push?
Going along with that USD breakout is a EUR/USD breakdown. I had looked at this level in an article that I had published for ZeroHedge yesterday, attempting to pick out support levels for the EUR/USD breakout. The price of 1.1120, a swing-low last in-play almost two years ago has helped to hold the low from the breakout. Below current prices, support potential exists around the 1.1075 area, the 1.1000 psychological level and, longer-term, a zone that runs from 1.0814-1.0863.
EUR/USD Price Weekly Chart

Chart prepared by James Stanley
GBP/USD Breakout Catches Support in Key Zone
I’ve been following the short-side of GBP/USD over the past couple of weeks, looking for a bearish breakout in a descending triangle formation. That breakout has taken-hold this week, and prices have already moved down to the targeted area around the confluent 1.2900 handle. This can make for a difficult time to investigate fresh bearish exposure considering that price action is sitting at two month lows. This can, however, open the door to retracement potential, with prior support from 1.2960-1.3000 re-opening the door for short-side strategies. Below current price action – support potential exists around 1.2829, 1.2783 and, longer-term, a bit zone of potential support from 1.2671 up to 1.2721.
GBP/USD Daily Price Chart
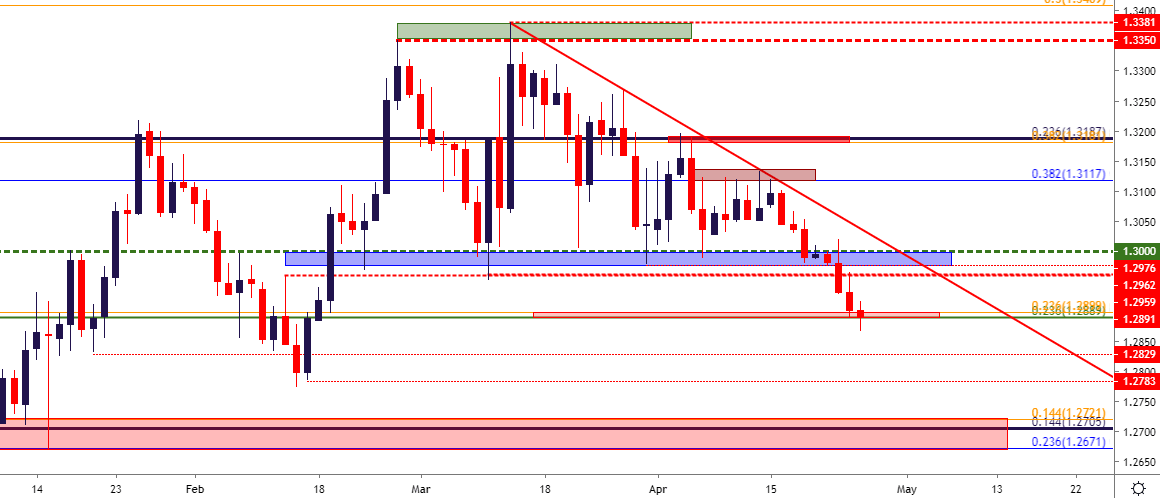
Chart prepared by James Stanley
Yen Strength Shows Up After BoJ
Also in that category of potential signals for oncoming risk aversion: Yen strength. This showed-up after the BoJ rate decision last night, and making matters more interesting is the ‘where,’ as USD/JPY tested a key area of resistance before showing an aggressive drop. This price is 112.34, and this is the 76.4% retracement of the November 2017 – May 2018 major move. Each of the retracement levels from this study have come into play this week, and the 112.34 price helped to set support for a large portion of Q4 last year. Prices in USD/JPY stalled at this level, and have since started to fall. The door hasn’t been closed yet on the bullish theme, but the momentum with which this move priced-in is notable, and should Yen-strength continue to show, that theme of risk aversion would build a bit more.
USD/JPY Price – Daily Chart

Chart prepared by James Stanley
To read more:
Are you looking for longer-term analysis on the U.S. Dollar? Our DailyFX Forecasts for Q4 have a section for each major currency, and we also offer a plethora of resources on USD-pairs such as EUR/USD, GBP/USD, USD/JPY, AUD/USD. Traders can also stay up with near-term positioning via our IG Client Sentiment Indicator.
Forex Trading Resources
DailyFX offers an abundance of tools, indicators and resources to help traders. For those looking for trading ideas, our IG Client Sentiment shows the positioning of retail traders with actual live trades and positions. Our trading guides bring our DailyFX Quarterly Forecasts and our Top Trading Opportunities; and our real-time news feed has intra-day interactions from the DailyFX team. And if you’re looking for real-time analysis, our DailyFX Webinars offer numerous sessions each week in which you can see how and why we’re looking at what we’re looking at.
If you’re looking for educational information, our New to FX guide is there to help new(er) traders while our Traits of Successful Traders research is built to help sharpen the skill set by focusing on risk and trade management.
--- Written by James Stanley, Strategist for DailyFX.com
Contact and follow James on Twitter: @JStanleyFX


