


The S&P 500 is quickly approaching a major resistance zone on what has been an impressive rally, but the upcoming obstacle may be the one to finally put buyers to the test. With the DAX as the laggard and trading around a major long-term trend-line it is still at risk of weakening, especially if the U.S. does soon. Crude oil remains firm and trending higher, risk is growing for another pullback but not willing to bet against it. Gold is quickly approaching a critical zone of resistance that could have quite a bit to say about how things unfold in the weeks ahead.
Technical Highlights:
- S&P 500 2800+ region viewed as strong resistance
- DAX lagging, 2011 trend-line keep strength suppressed
- Crude oil continues to maintain a bid, but risk rising
- Gold is approaching a major long-term inflection point
Check out our Trading Forecasts and Educational Resources on the DailyFX Trading Guides page.
S&P 500 2800+ region viewed as strong resistance
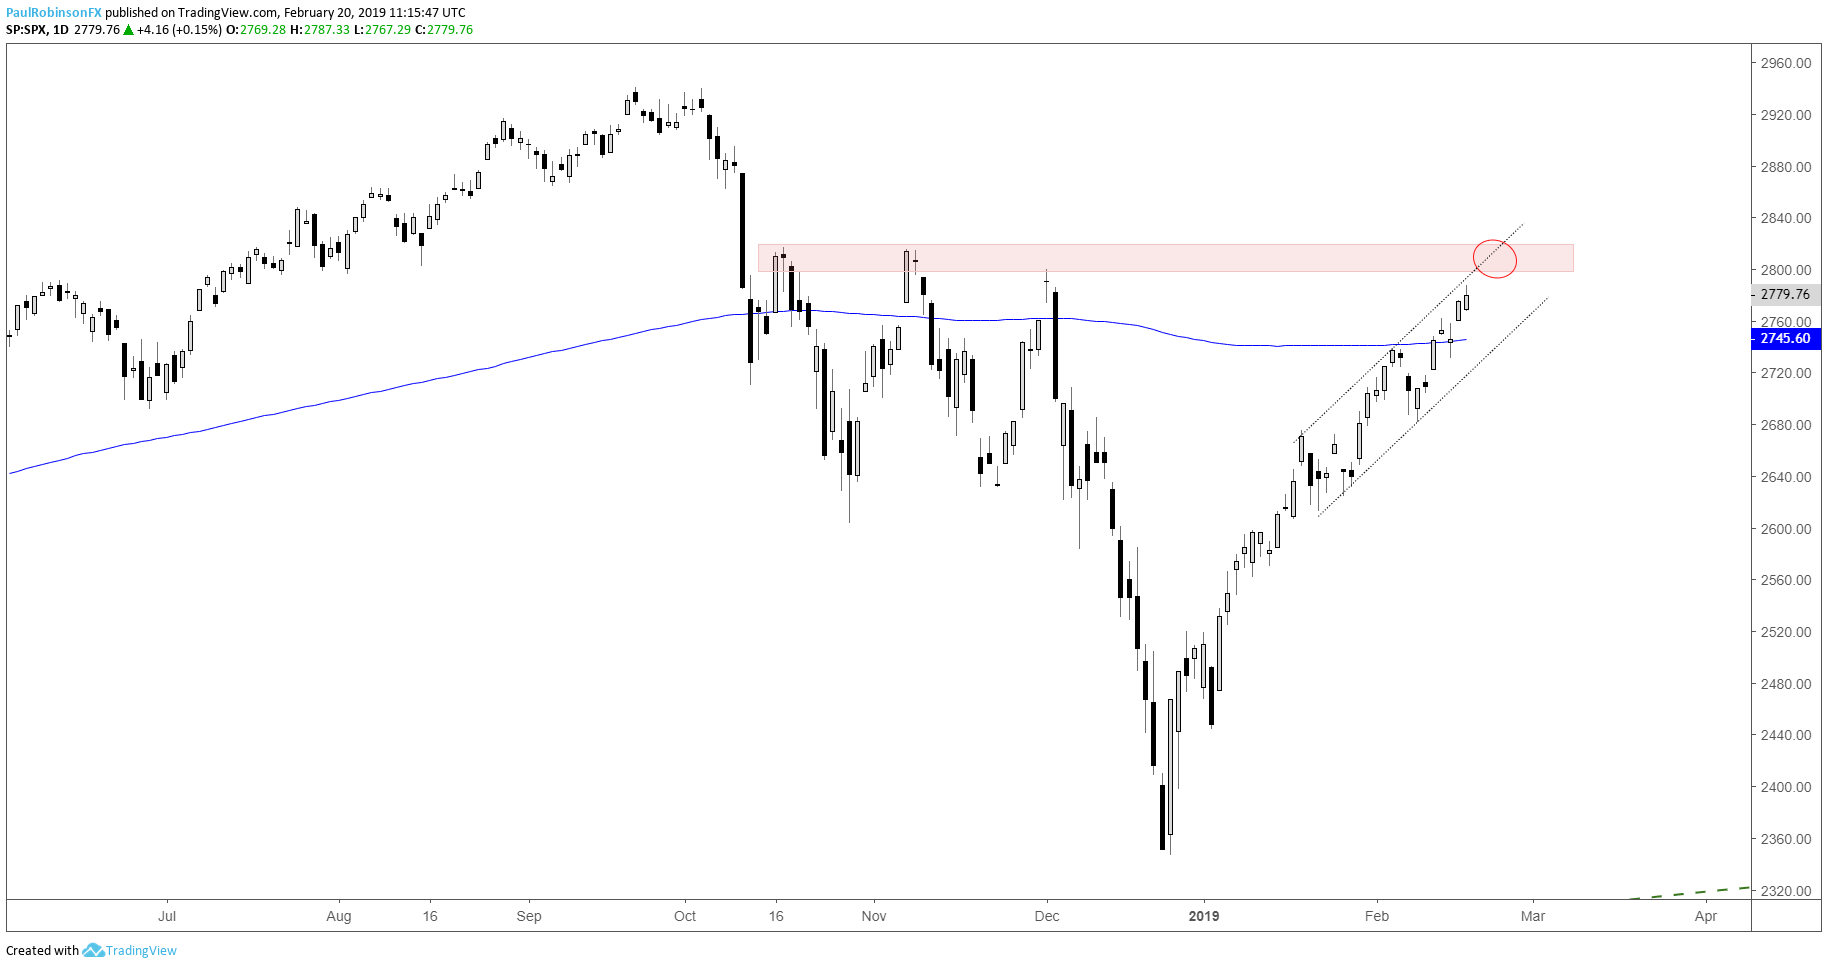
The S&P’s impressive surge has shredded levels along the way, but the area from 2800 to 2817 may make for a different type of obstacle given the distance the market has come, and the multiple turning points created in the 17-handle range. There is still a little room to go before a thorough test develops, but should bearish price unfold up there then look for the market to finally take back some of its gains.
S&P 500 Daily Chart (2800/17 resistance)
For an intermediate-term fundamental and technical outlook check out the Global Equities Forecast
DAX lagging, 2011 trend-line keep strength suppressed
The DAX is a global laggard and that fact on its own puts it at risk of a downturn should other markets, specifically the largest and strongest – the U.S. – run into trouble. The 2011 trend-line is a big area of resistance, too, so that adds additional pressure. The German benchmark could pop on through and catch up to other markets, but that is viewed as the low probability scenario at this time. A solid short may soon set up.
DAX Daily Chart (2011 t-line)

Crude oil continues to maintain a bid, but risk rising
The benefit of the doubt has been with crude oil to trade higher following pullbacks despite the dips being rather deep into the prior upswings. This makes the pushes to a new high risky for new longs as long as this behavior continues. Perhaps the newest swing higher will turn into a consolidation and strengthen the case for oil at these prices, but we’ll need to wait a few days to see if this can be the case. It’s a tough spot with longs at risk of a pullback, but shorts look even more difficult.
Crude oil Daily Chart (Another higher-high)

For an intermediate-term fundamental and technical outlook check out the Crude Oil Forecast
Gold is approaching a major long-term inflection point
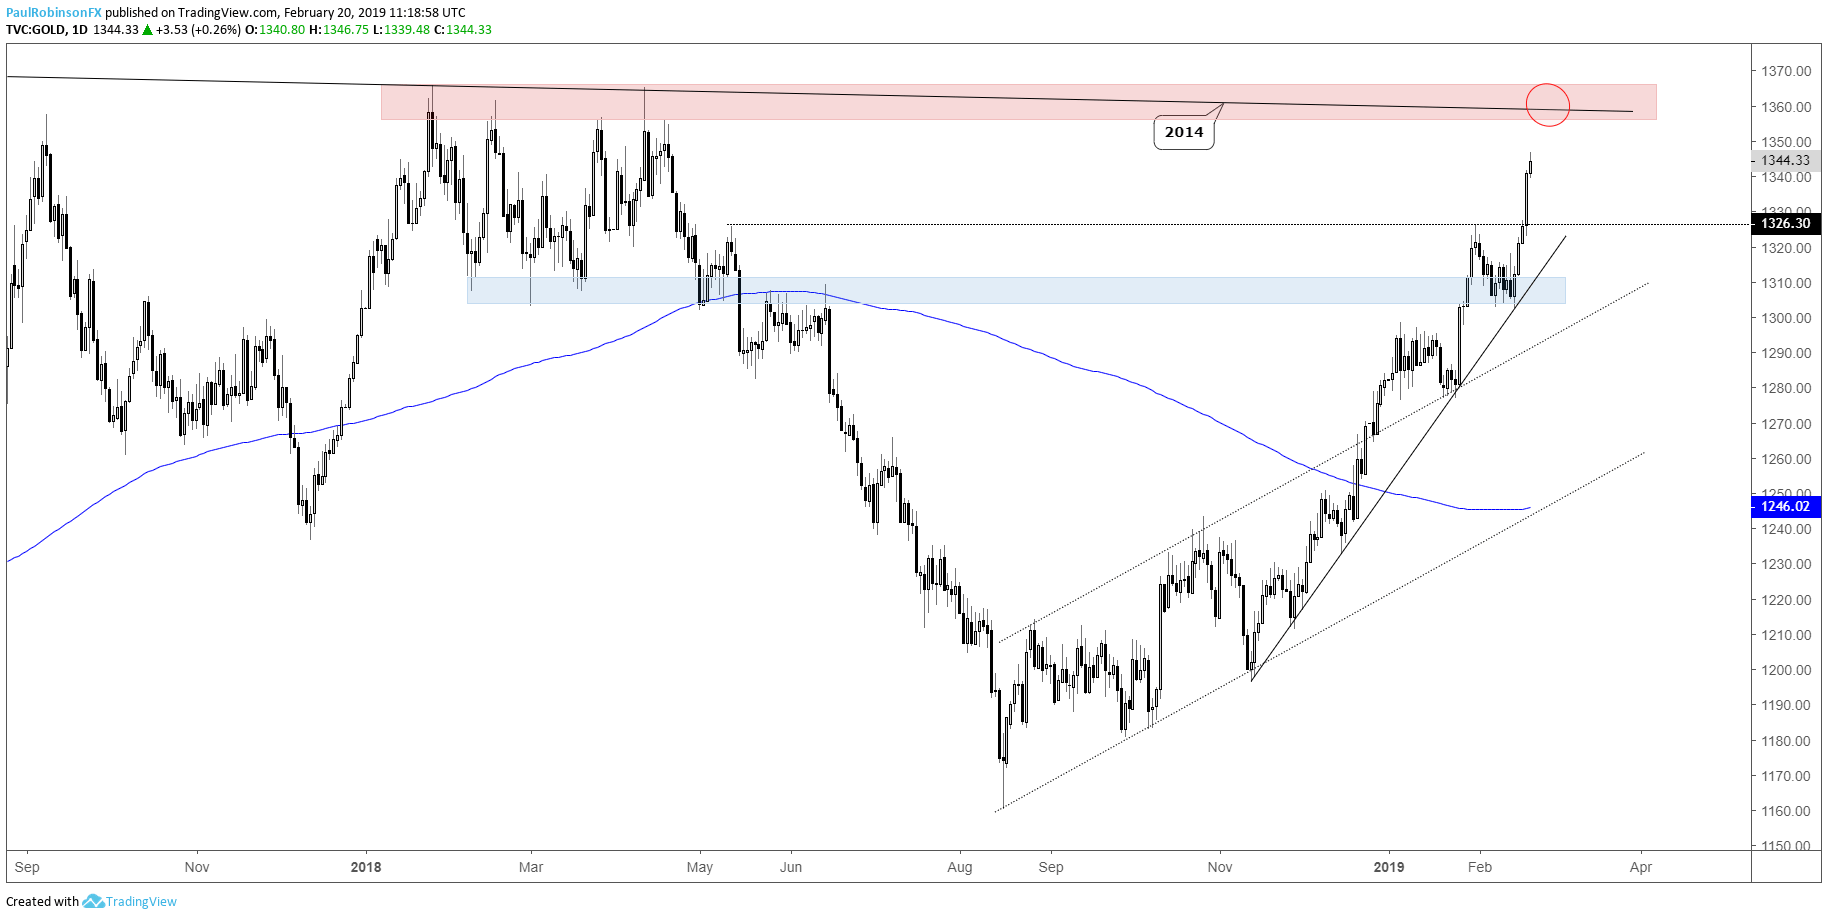
Gold continues to make good on its rally since the summer, but that could be in jeopardy as major long-term resistance shows up from around 1350 up to 1366. Price peaks formed last year around the 2014 trend-line and between price and t-lines it is seen as likely gold will have a difficult time getting through at this time. Bearish price action at resistance will appear to be an invite for would-be shorts.
For an intermediate-term fundamental and technical outlook check out the Gold Forecast
Gold Daily Chart (1350/66 soon to come into play)
Resources for Index & Commodity Traders
Whether you are a new or an experienced trader, DailyFX has several resources available to help you; indicator for tracking trader sentiment, quarterly trading forecasts, analytical and educational webinars held daily, and trading guides to help you improve trading performance.
We also have a series of guides for those looking to trade specific markets, such as the S&P 500, Dow, DAX, gold, silver, crude oil, and copper.
---Written by Paul Robinson, Market Analyst
You can follow Paul on Twitter at @PaulRobinsonFX


