


The Euro may finally be on its way to making a one-way move lower with volatility due to pop and a key chart pattern breaking. GBP/JPY has rallied strongly into a confluence of resistance, watching for signs it may want to turn lower. Gold is holding onto a trio of support but at risk of failing if we see a strong push by the Dollar. The Dow may head right into an important are of resistance next week where sellers may finally emerge.
Technical Highlights:
- EUR/USD breaks pattern, volatility due to rise
- GBP/JPY is trading at price, t-line resistance
- Gold continues to hold a trio of support (for now)
- Dow Jones may have t-line, 200-day to contend with soon
See where our team of analysts see your favorite markets and currencies headed in the months ahead on in the Q1 Trading Forecasts.
EUR/USD breaks pattern, volatility due to rise
The Euro outlook has been mired by choppy trading conditions but that could be about to change. The 3-month percentage range is the smallest it’s been since 2014 and just below levels more recently where sizable moves soon developed. Bottom line, vol is due to pop. With the underside of the bear-flag getting undercut that move may have just started. In the near-term the 11100-line may soon come under assault.
EUR/USD Daily Chart (Vol to pick up, breakdown could trigger it)
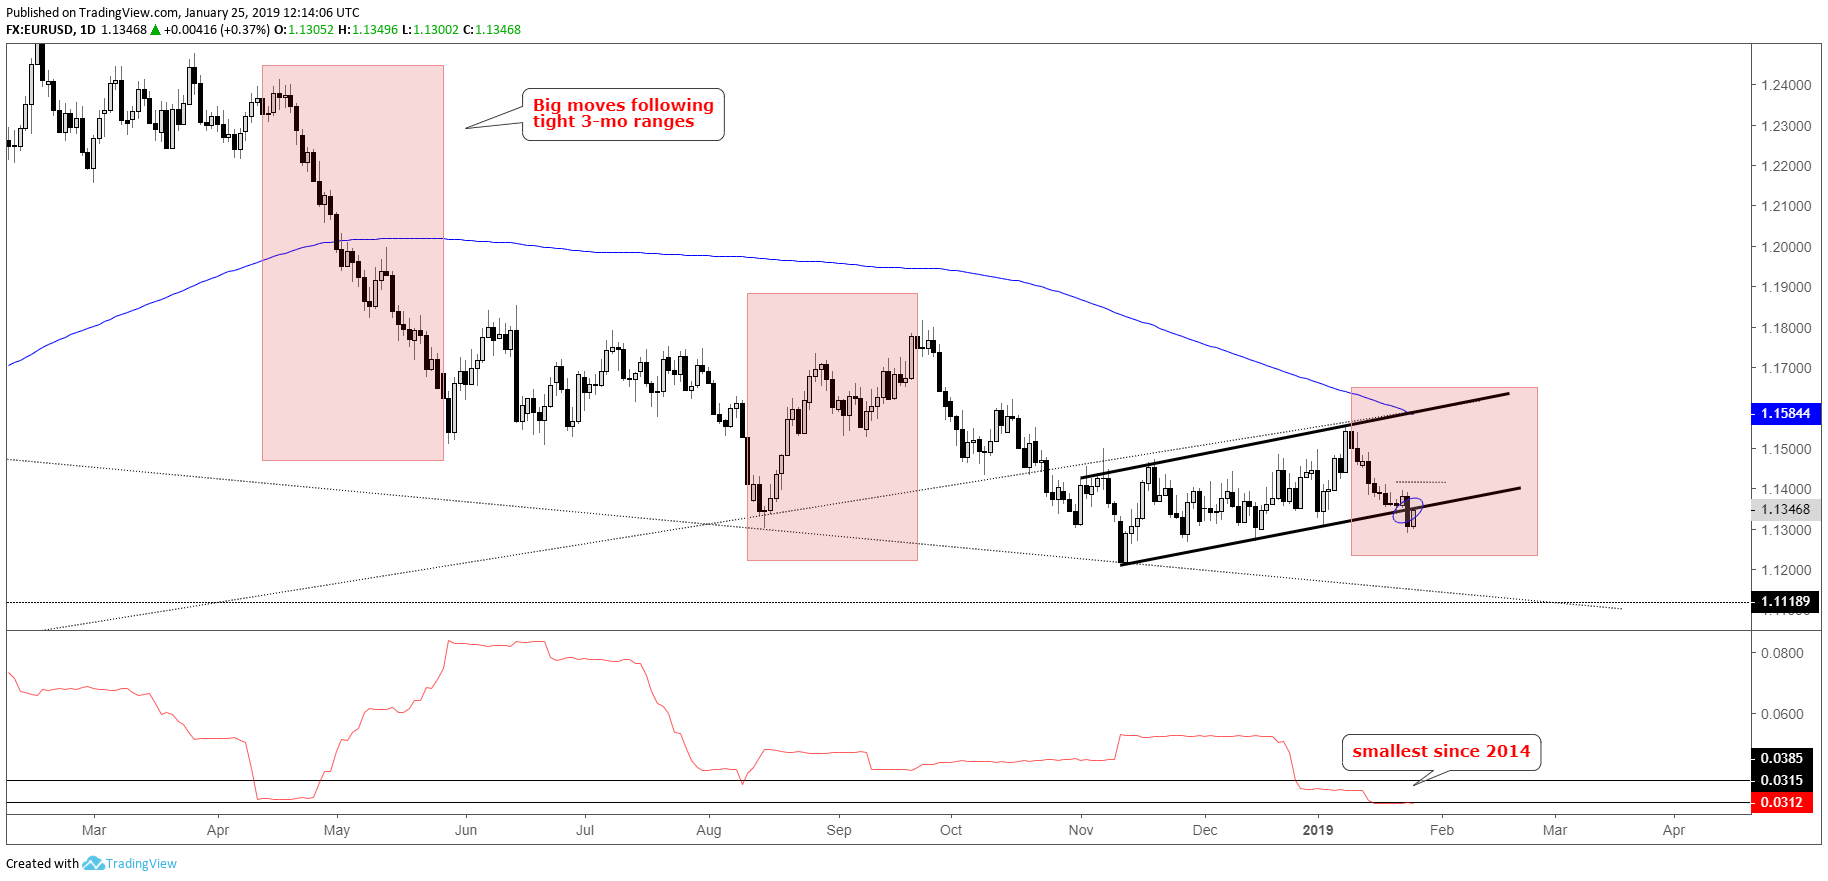
*Indicator on chart created by Chief Strategist John Kicklighter
Check out the recently released Q1 Euro Forecast to see our analysts’ intermediate-term fundamental and technical outlook.
GBP/JPY is trading at price, t-line resistance
GBP/JPY has rallied impressively since the flash-crash earlier this month, but now sits up against resistance in two forms. The underside of a trend-line from October 2016 and price resistance. Watching for signs of turning momentum, though, before running with a bearish bias.
GBP/JPY Daily Chart (Confluent resistance)

Check out the recently released Q1 JPY Forecast to see our analysts’ intermediate-term fundamental and technical outlook.
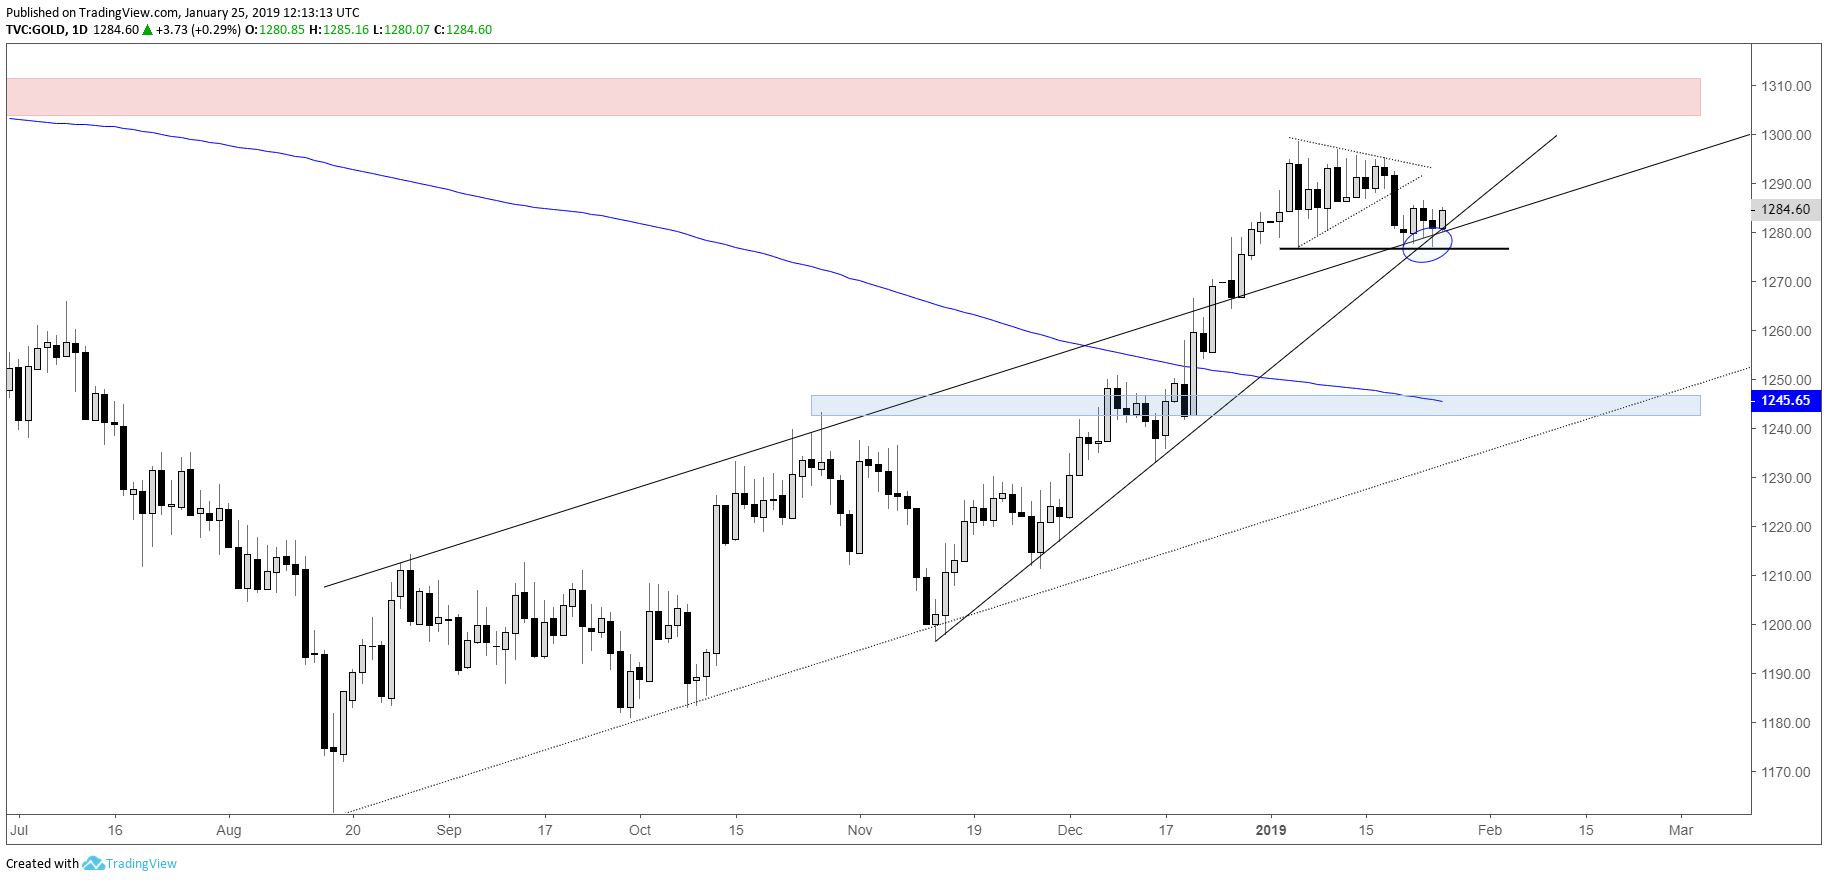
Gold continues to hold a trio of support (for now)
Gold is sitting on an important area of support, with three forms of support holding it up right now; upper parallel, trend-line, bottom of broken triangle. It has tested the 1276 level twice this week and for as long as it holds so will a neutral to bullish outlook. A break on the other hand will likely usher in a fair amount of selling given the growing importance of support.
Gold Daily Chart (Sitting on strong support)
Check out the recently released Q1 Gold Forecast to see our analysts’ intermediate-term fundamental and technical outlook.
Dow Jones may have t-line, 200-day to contend with soon
The Dow continues to hold a bid and looking like it may want to head a bit higher before retreating. Just ahead there is the trend-line in conjunction with the 200-day MA. This so happens to also coincide with the psychological 25k mark. Should a rejection develop at resistance, I’ll look for that to be the queue that a price decline could finally be underway.
Dow Jones Daily Chart (t-line/200-day)

Check out the recently released Q1 Equities Forecast to see our analysts’ intermediate-term fundamental and technical outlook.
Resources for Forex & CFD Traders
Whether you are a new or an experienced trader, DailyFX has several resources available to help you; indicator for tracking trader sentiment, quarterly trading forecasts, analytical and educational webinars held daily, trading guides to help you improve trading performance, and one specifically for those who are new to forex.
---Written by Paul Robinson, Market Analyst
You can follow Paul on Twitter at @PaulRobinsonFX


