Talking Points:
- Certain parts of the US Treasury yield curve have inverted recently and the 2-10 spread is very close to flipping
- Curve inversion is often considered a reading of impending recession, but market influences have likely distorted the signal
- Global government bond yields have dropped in tandem signaling a broader fear in growth and financial conditions
What makes for a 'great' trader? Strategy is important but there are many ways we can analyze to good trades. The most important limitations and advances are found in our own psychology. Download the DailyFX Building Confidence in Trading and Traits of Successful Traders guides to learn how to set your course from the beginning.
An Inverted Yield Curve, Economists' Favorite Recession Signal
The headlines were booming Tuesday. Against the backdrop of a US equity rout, there was a need to explain the fear so as to make it more palatable. Naturally, one of the first places the speculative rank turned to sap the power of a welling panic was the details behind the US-China trade wars 'breakthrough'. Given the general course this deteriorating economic relationship has taken through 2018 and the many false starts of hope for false dawns, it is natural a closer scrutiny would rouse concerns. Personally, I believe the explanation for the intensity of this move was more mundane: the US market closure Wednesday raised concern over the frequency of headline shocks and the inability to reduce risk owing to the liquidity drain. Yet, whatever the primary fear for investors, there was another surprising story that received remarkable attention Tuesday: the US yield curve. A comparison of the yield across different durations of Treasuries, the premium for leading capital to the US government for a longer period of time relative to a short duration (giving more time for something to go wrong) was the smallest in over a decade. What's more there were certain portion of the curve (like the 2-3 year segment) that have actually inverted. The word 'inverted' immediately triggers a shiver from economists and traditional investors as it is considered an undeniable indicator of recession.
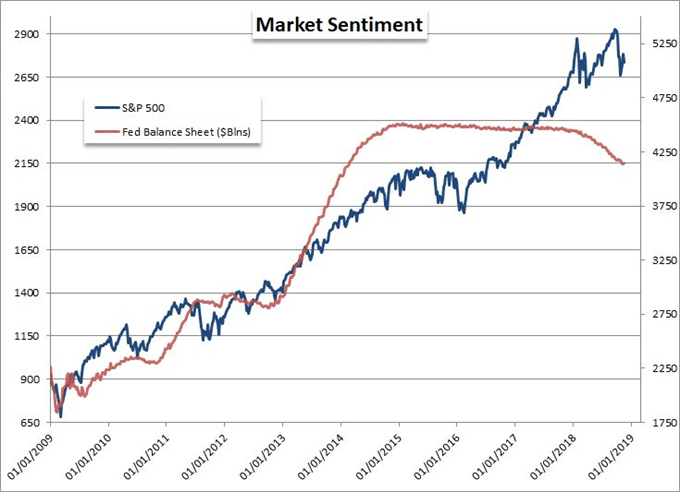
Chart of the S&P 500 and Fed balance Sheet (Weekly)
Deeper Cuts in the Fundamental Weight of Yields
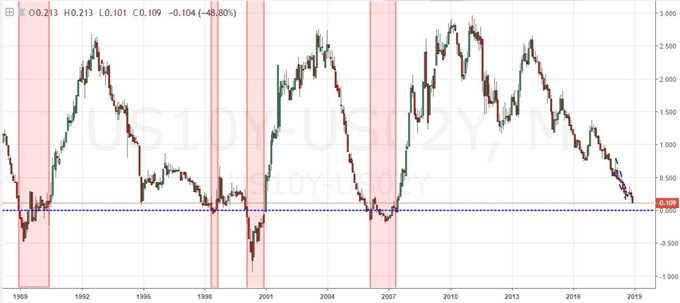
An inverted yield curve is a very unusual development in US Treasury rates. And, if we look back over the past decades, such events have a tendency to align distinctly to recessions and/or financial threats. The traditional 2-10 spread has yet to flip, but it is extremely close with the smallest premium to the benchmark duration since 2007. Given the alignment to the beginnings of the Great Financial Crisis, it comes as no surprise that there is a straight line assumption being made. However, there are significant distortions at work to this efficacy of this signal. In particular, the extreme policies of the Federal Reserve (and other major central banks) to cut rates essentially to zero and adopt an extreme and unorthodox stimulus program in which Treasuries were primary target would lead to heavy skew in longer dated yields and stoke questionable speculation across the financial system. Since the peak in balance sheet build up, there has been a sufficient period for plateau and the inevitable slow roll off of assets from the Fed's portfolio. Recognizing the entire situation and its distortion of risk trends can certainly contribute to financial instability, but that does not inflate the accuracy of the traditional recession signal for which this is typically used. As upended as the yield curve may be as a traditional signal, it can still indicate troubling circumstances for the financial system. The withdrawal from the Fed can stoke concern for more than one reason for example.
Chart of 10-Year – 2-Year Treasury Yield Spread with Indication of Recessions (Monthly)
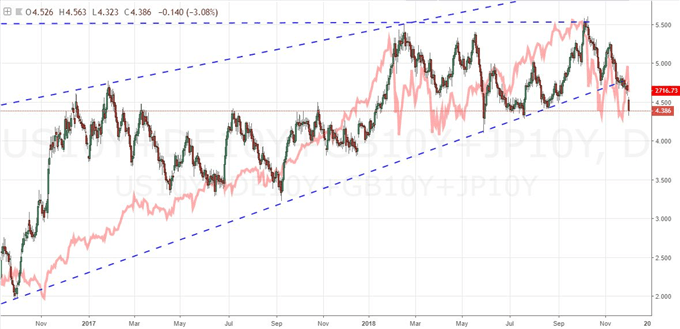
More than Just US Rates are Dropping Which Should Worry Investors
While the structure of US rates was the focus of government bond market observations lately, it is worth noting that the US 10-year Treasury yield wasn't the only major region's financial baseline that dove through this past session. In fact, there were significant declines in standard 10-year measures in Asia (like the Japanese JGB) and European (UK Gilts and German Bunds). There is something far more fundamental in the level and rate of change for the world's government bond yields. Given Treasuries' position in the traditional portfolio, a drop in yields is similar to a drop in benchmark equity indices. Yet, the comparison between these two key assets show yields are historically the more steadfast reflection of economic activity and speculative appetite. As the S&P 500 oscillates wildly as it has the past few months, the progress on the US 10-year rate should draw greater caution for investors in the region's assets - and those navigating global markets as well consider the reach of US sentiment. If this slide in US and global yields continues, it is increasingly likely that we are witnessing the conversion to true and lasting risk aversion for global markets. For carry trade, appetite for Dollar-based long interest and nascent appetite for the struggling, former carry benchmarks (Australian and New Zealand Dollars); there is a significant build up in pressure. We focus on the slide in government bond yields and the fixation in the yield curve in today's Quick Take Video.
Chart of US, Germany, UK, Japan 10-Year Treasury Yields and S&P 500 (Daily)