


SP 500 continues a bearish sequence of patterns implying much lower levels. US Dollar appears to be entering a near term bearish Elliott wave cycle.
The video above is a recording of a US Opening Bell webinar from November 26, 2018. We focused on the Elliott Wave and patterns for key markets such as SP 500, NASDAQ, USDJPY, NZDUSD, US Dollar Index, EURUSD, Natural Gas, and crude oil.
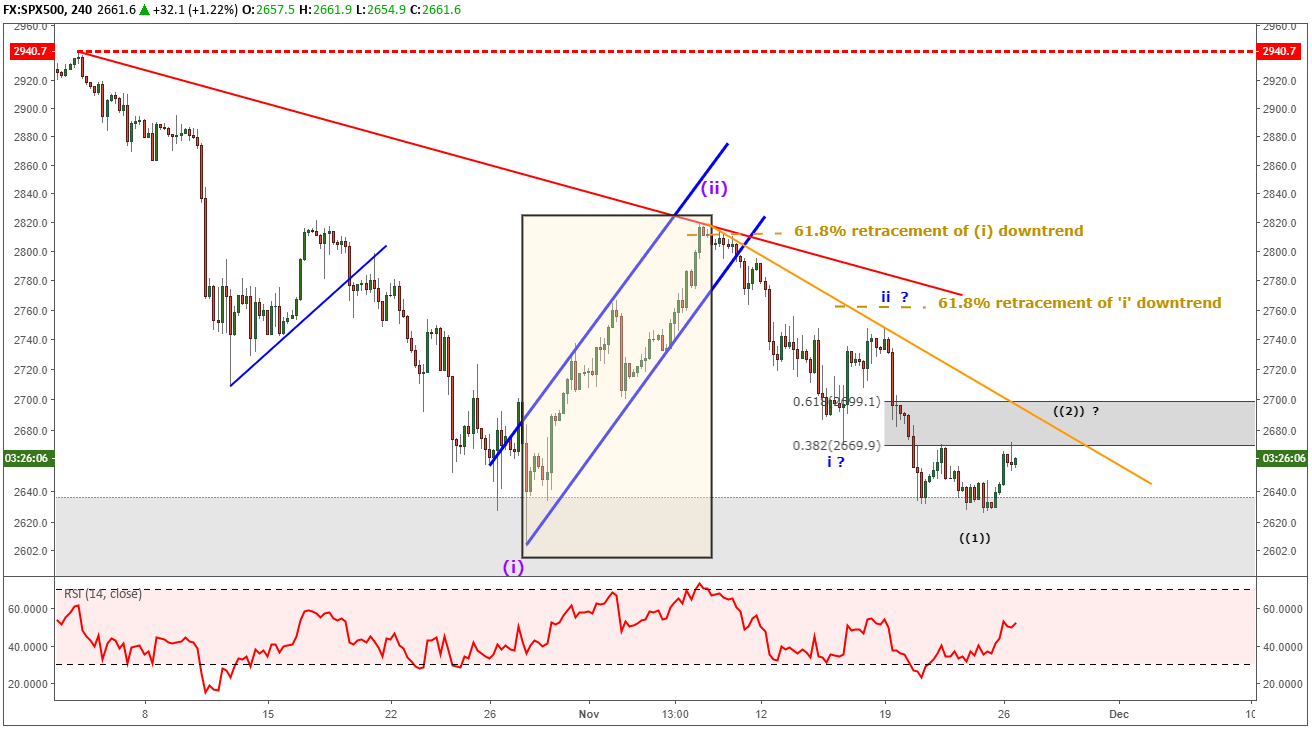
S&P 500 Elliott Wave Chart Struggles to rally above Fibonacci resistance
In last week’s webinar, we noted wrote how S&P 500 pattern warns of weakness. Though it was a holiday week, S&P 500 did finish the week lower and on its heels. This pattern of falling impulsively while rallying in three waves in concerning about the medium term outlook. This type of behavior is overall bearish and suggests much lower levels may be on the horizon.
In the S&P 500 chart below, notice how each subsequent rally is becoming smaller and smaller while struggling to surpass the previous trend’s 61.8% Fibonacci retracement level. This type of pattern begs for respect that equities may unload a third of third wave lower.
For those unfamiliar with Elliott wave terminology, third waves tend to be the longest and strongest of the 8-wave cycle. If the October 29 low is broken, I believe it becomes a hint of an eventual correction down to 1800. A breakdown of that nature is likely ushered in with an increased in VIX and volatility levels.
Additional reading…
How to Trade S&P 500 Index: Strategies, Tips & Trading Hours
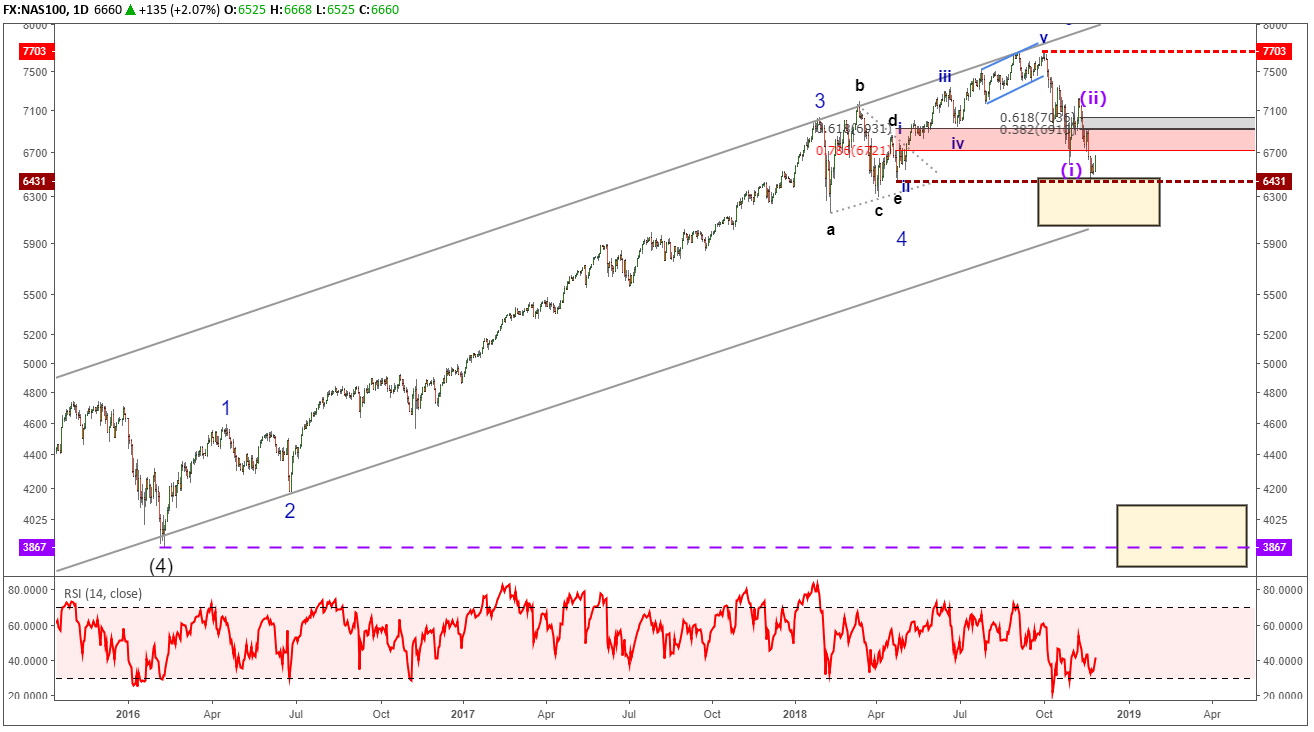
NASDAQ has been relatively weak recently
Nasdaq 100 sports a similar pattern to S&P 500 above but has been struggling even more. Nasdaq has already broken below its late October low so if S&P 500 confirms the break down, then it respect needs given to the third of third wave pattern noted above. If this extremely bearish pattern plays out for Nasdaq 100, then a break down may eventually move the market towards 3800.
Additional reading…
Nasdaq trading basics: how to trade Nasdaq 100
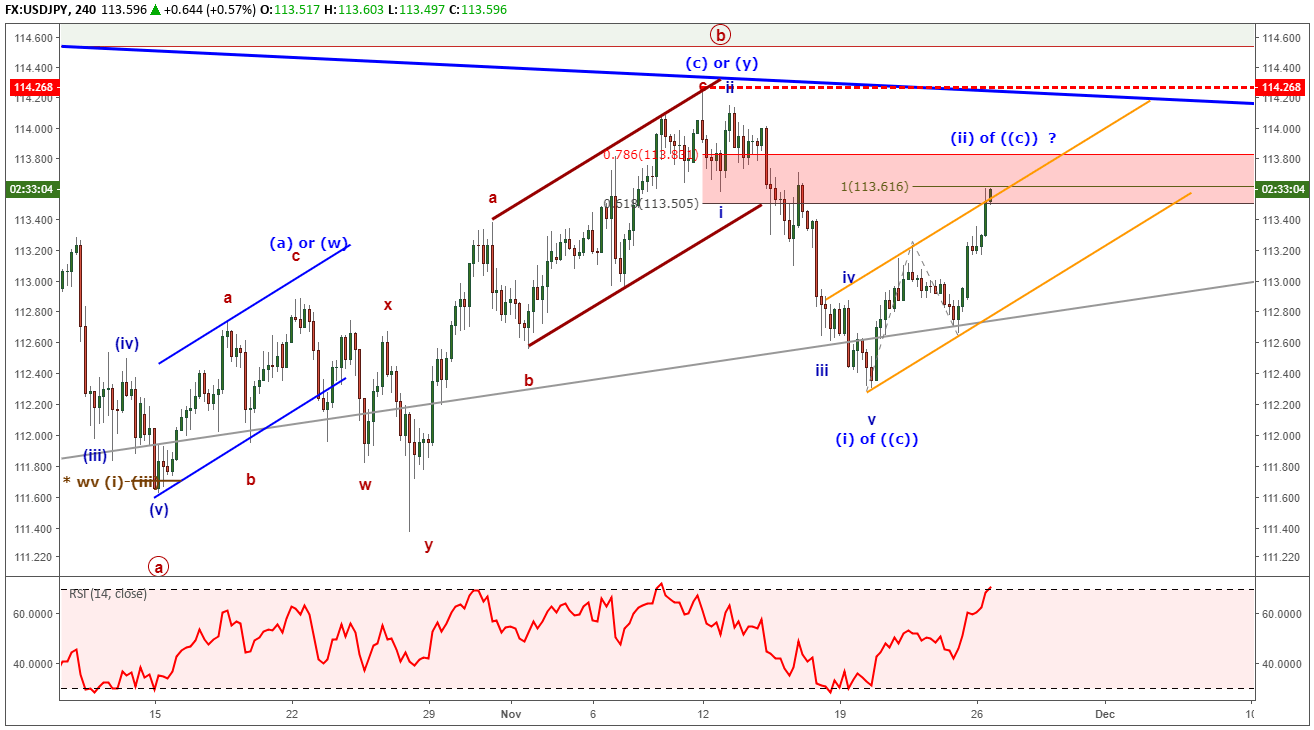
USD/JPY Rallies, but weakness is anticipated
USD/JPY has been trading in a wider range since we forecasted a bearish turn while below 114.56. We saw an initial drop last week to the low 112’s only to rally from there. It appears the low from last week may be wave (i) of circle ‘c’. Therefore, the current rise may turn out to be temporary and stall below 114.27 and possibly in the 113.50-113.80 price zone. If this pattern plays out, we will look for an eventual drop below 111 and possibly to 108.
It is possible we may be nearing the end of a three year triangle, so unanticipated moves will cause us to reassess the bigger picture patterns.
NZDUSD Elliott Wave Count still unfinished for bulls
We wrote recently how the NZDUSD Elliott wave pattern was incomplete to the upside with greater bullish implications. The high on November 16 for NZDUSD does leave the interpretation of the pattern with options; both higher probability options suggest more upside potential. The difference between the two main options are how low does NZD/USD dip prior to continuing its up trend.
We are of the mindset the current set back will be brief before a bullish breakout towards .7000. If prices do fall below .6706, then a deeper correction while holding above .6423 will be considered.
Find out what we learned by studying millions of live trades in our Traits of Successful Traders research.

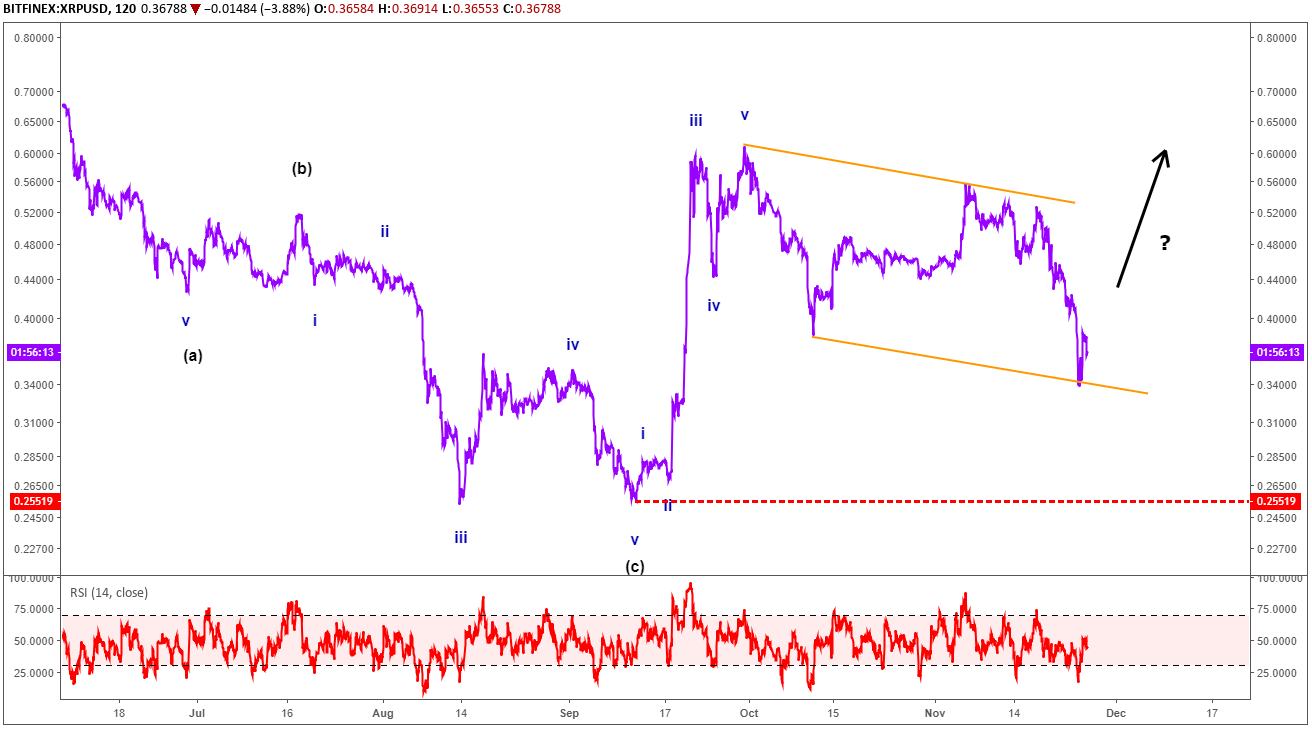
Ripple Elliott Wave chart points to bullish 5-3 pattern
Ripple’s chart shows an impulsive rally from the September low while correcting in three waves. This 5-3 pattern is bullish overall as we focus towards higher levels. Ripple's price has remained inside of the downward sloping channel while tagging support. Therefore, it is possible Ripple may rally from nearby levels as bullish base builds. Consider the bullish forecast for Ripple prices so long as it remains above .2550.
Elliott Wave Theory FAQ
How does Elliott Wave theory work?
Elliott Wave theory is a trading study that identifies the highs and lows of price movements on charts via wave patterns. Traders analyze the waves for 5-wave moves and 3-wave corrections to determine where the market is at within the larger pattern. Additionally, the theory maintains three rules and several guidelines on the depth of the waves related to one another. Therefore, it is common to use Fibonacci with Elliott Wave analysis. We cover these topics in our beginners and advanced Elliott Wave trading guides.
After reviewing the guides above, be sure to follow future Elliott Wave articles to see Elliott Wave Theory in action.
---Written by Jeremy Wagner, CEWA-M
Jeremy Wagner is a Certified Elliott Wave Analyst with a Master’s designation. Jeremy provides Elliott Wave analysis on key markets as well as Elliott Wave educational resources. Read more of Jeremy’s Elliott Wave reports via his bio page.
Communicate with Jeremy and have your shout below by posting in the comments area. Feel free to include your Elliott Wave count as well.
Discuss these markets with Jeremy in Monday’s US Opening Bell webinar.
Follow me on Twitter at @JWagnerFXTrader .
Recent Elliott Wave analysis you might be interested in…
Ripple Dips Into Support as Bullish Base Builds
NZDUSD Elliott Wave Analysis: Bullish Impulse Suggests More Upside


