


FX Price Action Setups in EUR/USD, USD/CAD, NZD/USD and USD/CHF
This is an archived webinar from yesterday (November 20th, 2018), and below are updated charts speaking to the same themes and setups as discussed in that session.
Tomorrow brings the Thanksgiving holiday in the United States, and the day after brings Black Friday along with half-day sessions across US equity exchanges. This can bring a backdrop of low-liquidity conditions across markets, FX included, and given some of the themes that remain in the headlines, that can lead to sharp moves that are even more unpredictable than usual. I had tried to account for this in the webinar, taking a longer-term or bigger picture look at some of the most pressing themes; and below, I look at updated charts around each of those major markets.
US Dollar Talking Points:
- If you’re looking to improve your trading approach, our Traits of Successful Traders research could help. This is based on research derived from actual results from real traders, and this is available to any trader completely free-of-charge.
- If you’re looking for a primer on the FX market, we can help. To get a ground-up explanation behind the Forex market, please click here to access our New to FX Trading Guide.
If you’d like to sign up for our webinars, we host an event on Tuesday and Thursday, each of which can be accessed from the below links:
Tuesday: Tuesday, 1PM ET
Thursday: Thursday 1PM ET
US Dollar Bounces From Key Support, Finds Trend-Line Resistance
In yesterday’s webinar, I looked at the US Dollar after a rather strong move had developed following a support test earlier in the morning. That support came in at a key area, as 96.04 is the 50% marker of the 2017-2018 bearish run in the currency, and this is the same price that helped to produce four different resistance inflections in the month of October.
US Dollar Four-Hour Price Chart

Chart prepared by James Stanley
Buyers showed-up on a re-test of that level, and largely remained in-control through the US session, helping to push USD back-up to 96.88. But, that bullish motivation seemed to wane as prices re-approached 97.00, and since yesterday’s US close the Dollar has held that resistance, getting an assist from a bearish trend-line as taken from last week’s lower-highs.
US Dollar Hourly Price Chart

Chart prepared by James Stanley
The longer-term backdrop in the Dollar is still bullish, as just last week saw fresh yearly highs print. But, prices may pose a deeper retracement before that long-term bullish trend is ready to continue. The focal point for now appears to be on whether buyers come-in to produce a higher-low above yesterday’s swing, and to meter that move, traders can look for a bullish break above the bearish trend-line to indicate the return of buyers. This can open the door for a re-test of the 97.50 high.
US Dollar Daily Price Chart
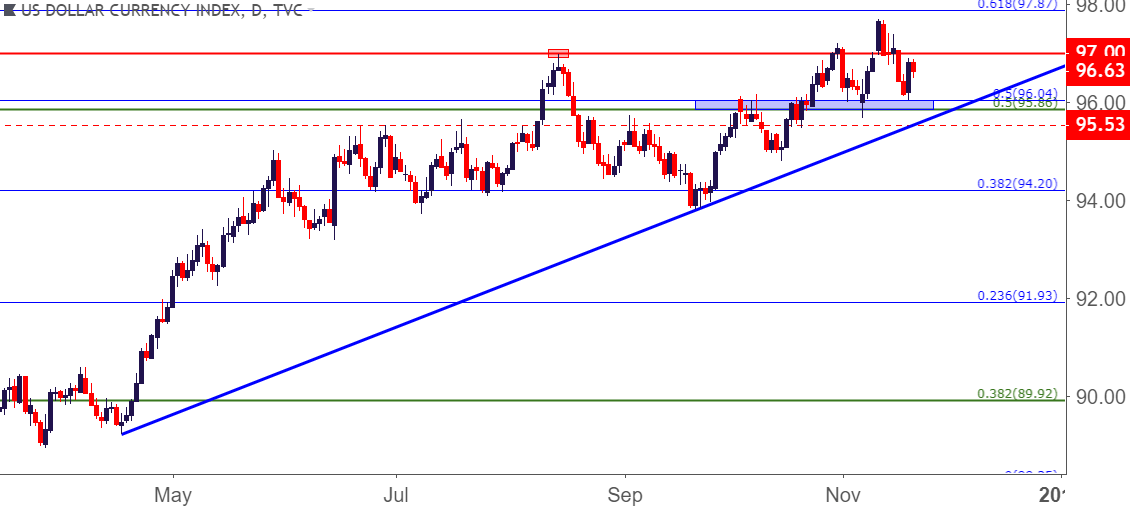
Chart prepared by James Stanley
EUR/USD Bounces From 1.1355
In yesterday’s webinar, I looked at short-term support level in EUR/USD that had previously functioned as a bit of resistance. This takes place at 1.1355, and this price helped to form a higher-low on EUR/USD in the overnight session. This produces a mirror image of the US Dollar backdrop looked at above, in which there’s a longer-term trend of weakness that may see a short-term item of strength before that bigger picture theme is ready to return. The big point of interest at this juncture is whether EUR/USD can re-test the resistance zone at 1.1448-1.1500, and whether sellers help to hold the highs at a lower-level than what was seen earlier in the week.
EUR/USD Four-Hour Price Chart
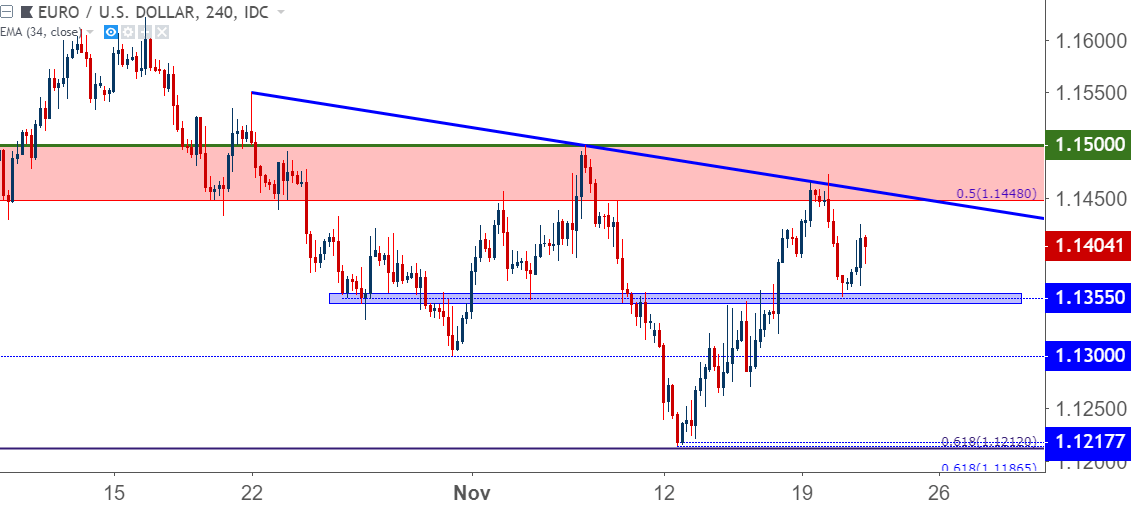
Chart prepared by James Stanley
Alternatively, traders can look for a down-side break through short-term support at 1.1355 to open the door for bearish breakout strategies targeting a 1.1300 re-test.
EUR/USD Hourly Price Chart

Chart prepared by James Stanley
GBP/USD in a Dangerous Spot for Bears
The Thanksgiving holiday will not quell headlines around Brexit, and when combined with low-liquidity conditions, this can be a dangerous market to be working with. Just one headline around the shaky dynamics of Brexit can produce a sharp move that may gap through stops.
While the backdrop here appears pretty negative given Brexit headlines of recent, bears may be in for a difficult ride as prices near a big batch of longer-term support. The level of 1.2671 helped to form the yearly low on the pair, and this was set back in August as a stern bearish trend ran into the 23.6% Fibonacci retracement of the Brexit move. When another bearish run neared this level in late-October, sellers shied away from a re-test, helping to produce a higher-low; and a similar instance happened last week on the heels of Dominic Raab’s resignation, when Sterling went back into a downward spiral that produced yet another higher-low.
GBP/USD Four-Hour Price Chart
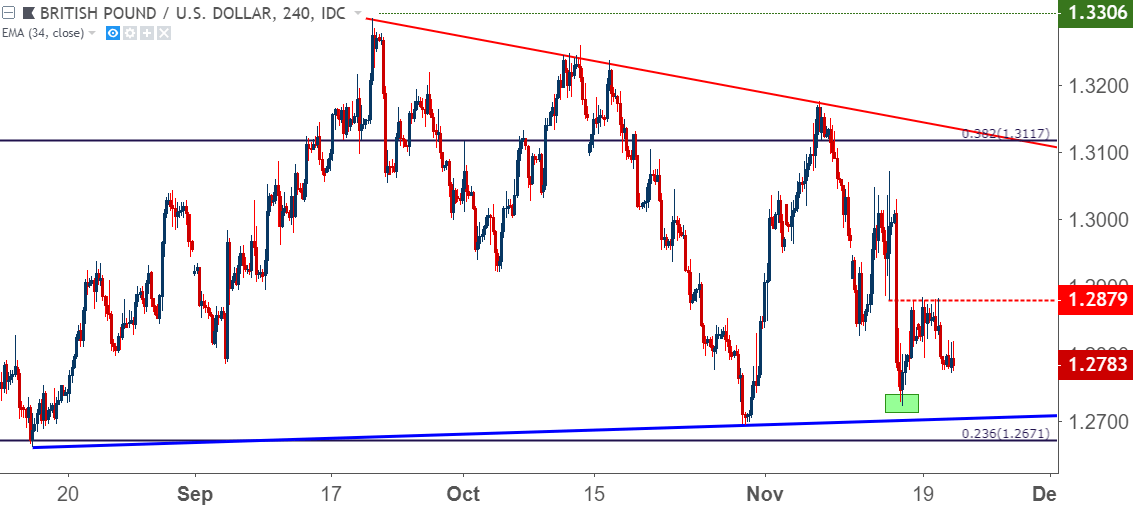
Chart prepared by James Stanley
On a bigger-picture basis, the pair remains in a bout of mean reversion that’s been going for more than three months now. Traders looking for directional trend-based plays can look for a break of this range to open the door to such strategies. But extreme caution should be utilized if doing anything in GBP markets around the Thanksgiving holiday.
GBP/USD Weekly Price Chart: Holding Higher-Lows Around Long-Term Support
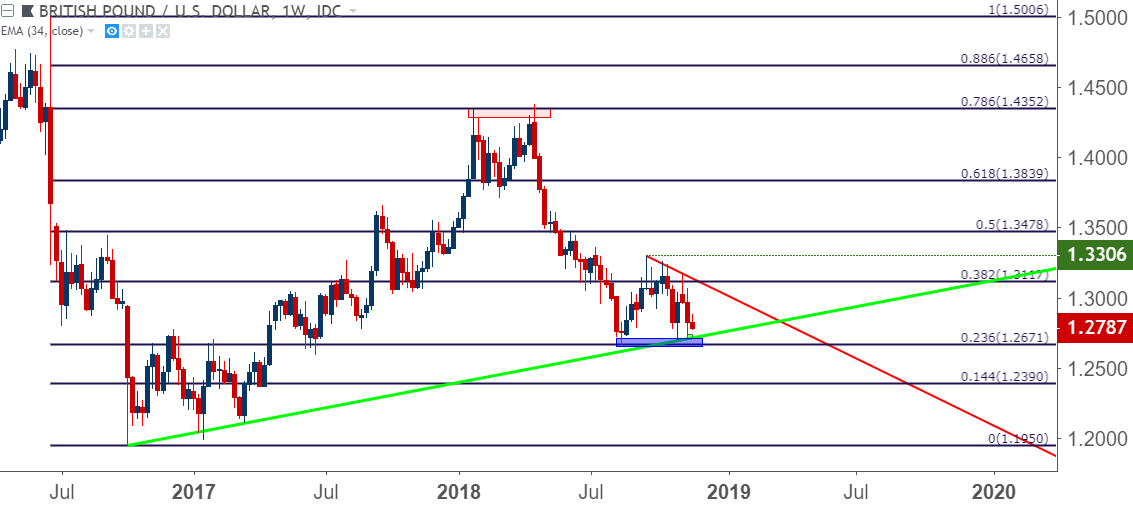
Chart prepared by James Stanley
USD/CHF with Bearish Potential After Fresh November Lows
On the short-side of the US Dollar, USD/CHF has become of interest over the past week following a break back-below the parity figure. I started looking at this in FX Setups of the Week two weeks ago with the goal of trading a reversal, and the theme of USD-weakness helped as prices pushed off of fresh two-year highs to break back-down below the parity figure.
A bit of support has played-in off of the 61.8% Fibonacci retracement of the 2016-2018 major move, and this is a very valid reason for a pause in the down-trend. This can open the door for lower-high resistance potential around that key price of parity.
USD/CHF Four-Hour Price Chart

Chart prepared by James Stanley
USD/CAD Bounce From Confluent Support to Fresh Four-Month Highs
On the long-side of the US Dollar, USD/CAD was set up in a fairly interesting manner coming into this week, finding a bit of support at a confluent area on the chart. The price of 1.3132 is the 61.8% retracement of the May-September, 2017 major move, and this level lined up with a bullish trend-line connecting the October and November swing-lows in the pair.
That support has led into a vigorous bounce so far this week, and prices have now set fresh four-month highs. The key at this point would be to look for a pullback around continuation approaches, and a zone of interest for such exists around the 1.3200 level on the chart.
USD/CAD Four-Hour Price Chart: Higher-Low Support Potential
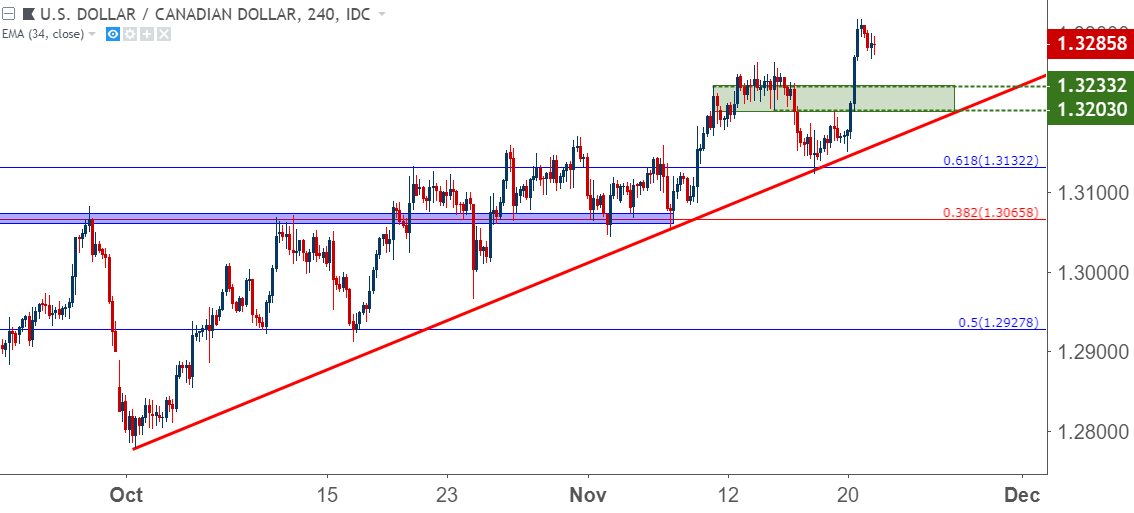
Chart prepared by James Stanley
AUD/USD: Support Zone Plays Out Again
Coming into this month, AUD/USD was an attractive setup for USD-weakness, and that theme largely remained through the first portion of November as a stark 2018 down-trend finally saw some element of retracement. Of issue and key for the approach was a confluent support zone that runs from .7185-.7205, as this helped to form support in the first and third weeks of the month. This price came into play again in the overnight session, and so far buyers are pushing ahead.
Traders should be very careful here, as this bounce comes on the heels of a rather consistent week-long sell-off. This doesn’t necessarily close the door on bullish approaches, as last night brought along a higher-low; but this does urge caution as the pair has went from extreme bearish coming into October into very bullish in the first few weeks of November.
Also of note – there is some remaining unfilled gap atop price action from this week’s open; which is only about five pips wide. This could be an area of resistance to be watchful of in the coming days.
AUD/USD Two-Hour Price Chart
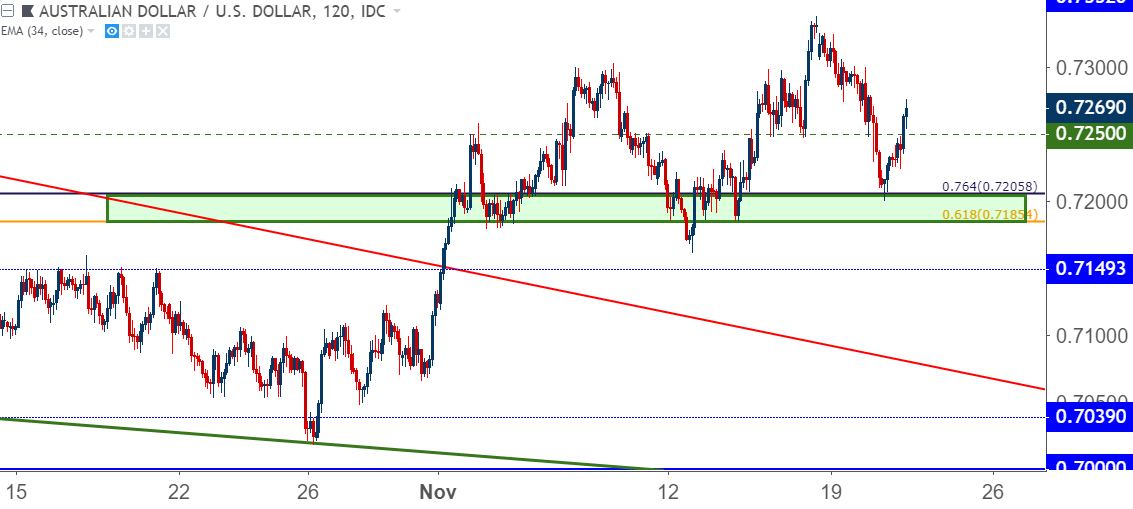
Chart prepared by James Stanley
NZD/USD With Deeper Pullback Potential
On a similar chord as the above in AUD/USD, NZD/USD has had a fairly visible bullish backdrop so far in November, and this comes after a 2018 that saw the currency spend much of the period in a bearish state.
The month of October was key, as USD-strength didn’t show so prominently in AUD/USD and NZD/USD, with each of those pairs digging into and showing some element of respect to longer-term support. This kept prices in the pair hanging on just long enough for USD-weakness to re-appear, at which point both AUD/USD and NZD/USD were free to fly-higher.
This led to fresh four-month highs in NZD/USD as the pair jumped in the first few weeks of November, crossing a number of resistance levels in the process. This week saw a quick bounce from support at one of those prior resistance levels of .6819, as this is the 23.6% Fibonacci retracement of the 2014-2015 sell-off in the pair. This is the same level that helped to set a quick swing-high earlier in the month around the RBNZ rate decision. And while that support did help to push prices back-up to another resistance level at .6870, bulls were unable to continue the move, and a steep drop developed yesterday to produce a fresh lower-low after a lower-high.
This indicates that NZD/USD may have a deeper retracement in store before the bigger-picture bullish trend might be ready to continue. Of watch for that theme is the bearish trend-line connecting the lower-highs of the past week; and a topside break of the resistance zone at .6870-.6877 could be construed in a bullish manner.
NZD/USD Hourly Price Chart

Chart prepared by James Stanley
To read more:
Are you looking for longer-term analysis on the U.S. Dollar? Our DailyFX Forecasts for Q4 have a section for each major currency, and we also offer a plethora of resources on USD-pairs such as EUR/USD, GBP/USD, USD/JPY, AUD/USD. Traders can also stay up with near-term positioning via our IG Client Sentiment Indicator.
Forex Trading Resources
DailyFX offers an abundance of tools, indicators and resources to help traders. For those looking for trading ideas, our IG Client Sentiment shows the positioning of retail traders with actual live trades and positions. Our trading guides bring our DailyFX Quarterly Forecasts and our Top Trading Opportunities; and our real-time news feed has intra-day interactions from the DailyFX team. And if you’re looking for real-time analysis, our DailyFX Webinars offer numerous sessions each week in which you can see how and why we’re looking at what we’re looking at.
If you’re looking for educational information, our New to FX guide is there to help new(er) traders while our Traits of Successful Traders research is built to help sharpen the skill set by focusing on risk and trade management.
--- Written by James Stanley, Strategist for DailyFX.com
Contact and follow James on Twitter: @JStanleyFX


