


The decline in crude oil off the 2008 trend-line has been relentless and without good support close at hand weakness may continue. Gold has been a difficult handle with choppy trading conditions dominating, but that may soon come to an end with another move higher. The S&P 500 has rebounded strongly off last month’s low, but is now squaring off with an important test of broken long-term trend support. The DAX remains in limbo as big long-term trend support is below but bearish topping pattern and trend keep pressure on.
Technical Highlights:
- Crude oil may see small bounce, but support not until lower
- Gold looking to make a run above resistance
- S&P 500 has test of long-term trend support coming
- DAX 30 caught between pattern/trend and long-term support
See how the majority of traders are positioned in various markets/currencies and what it says about future price fluctuations – IG Client Sentiment
Crude oil may see small bounce, but support not until lower
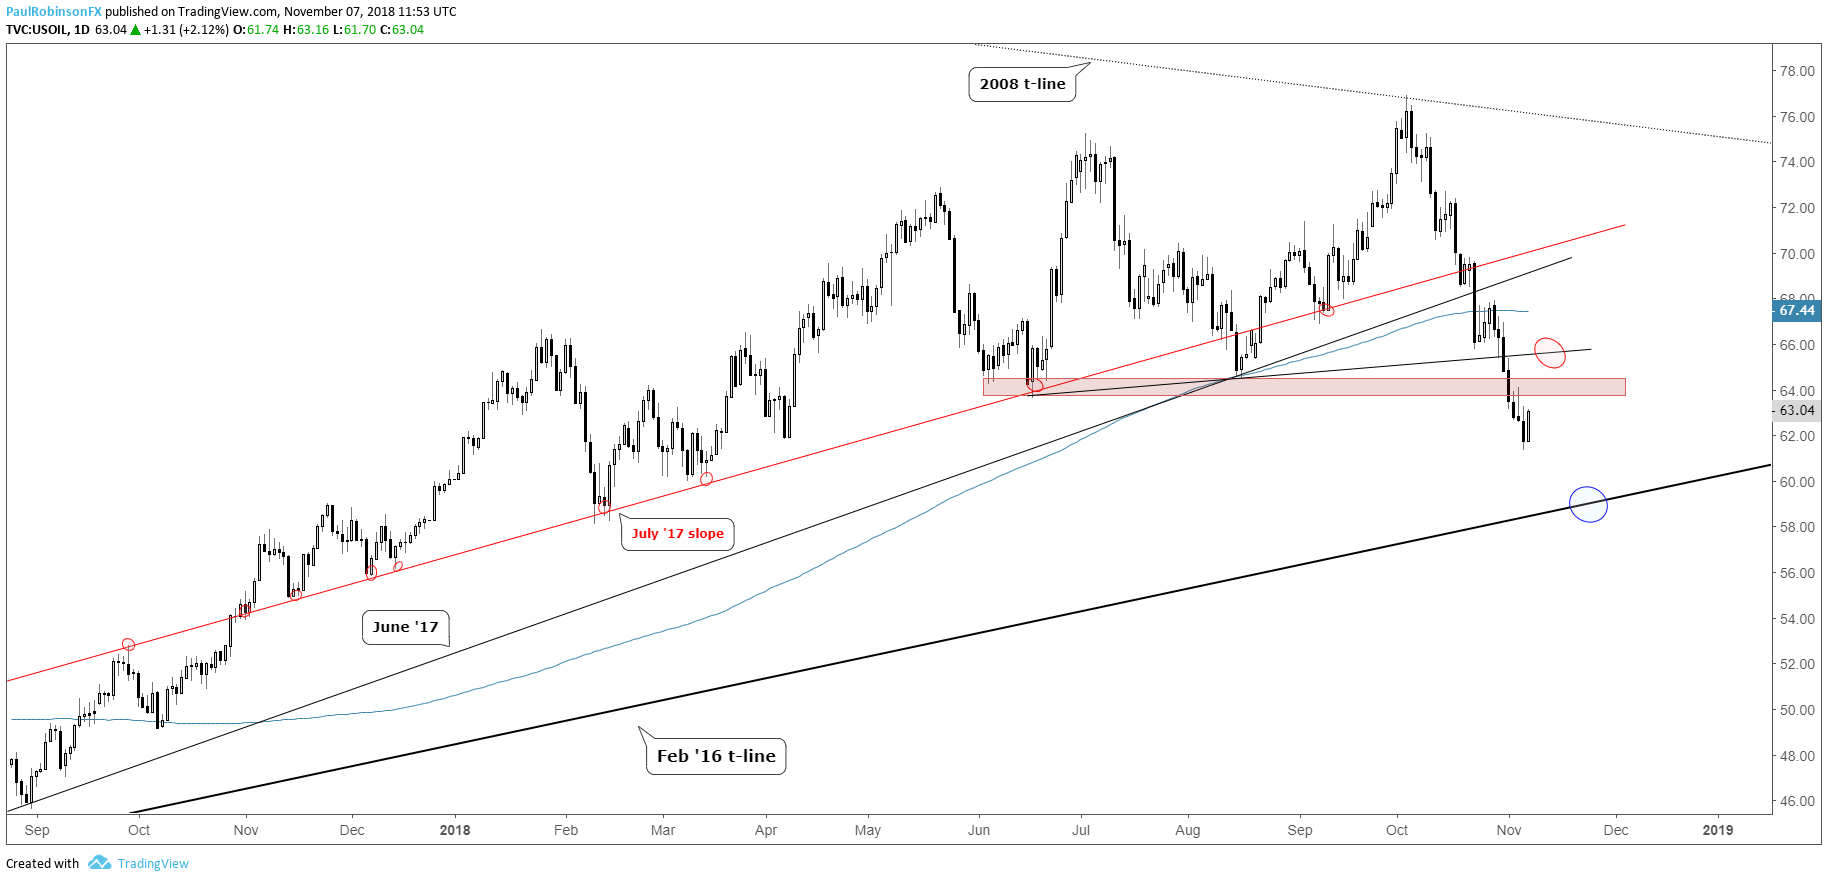
Since topping at the 2008 trend-line, crude oil has fallen precipitously and in the process taken out several support lines and price levels. The most recent decline took out lows from August and June, now putting those former levels of support in as resistance.
Crude is due to bounce, but watch for sellers to emerge in the vicinity of 63.60 up to 64.50, with the trend-line connecting the summer lows near 65.50 as the last line of short-term resistance. Looking lower, oil has further to drop with the Feb 2016 trend-line not arriving until under 59.
Crude Oil Daily Chart (Resistance on bounce, support at t-line)
For our intermediate-term fundamental and technical take, see the Q4 Crude Oil Forecast
Gold looking to make a run above resistance
Gold is trying to consolidate below resistance in the high-1230s, low 1240s. The general slope of the market is higher since August, and with that there looks like more strength could be in store. A little more congestion could get price action wedged up further, making for a more explosive situation. On a breakout above 1243, watch the upper parallel and then the December 2015 trend-line and 200-day should momentum really start picking up.
Gold Daily Chart (Looking to push above resistance)

For our intermediate-term fundamental and technical take, see the Q4 Gold Forecast
S&P 500 has test of long-term trend support coming
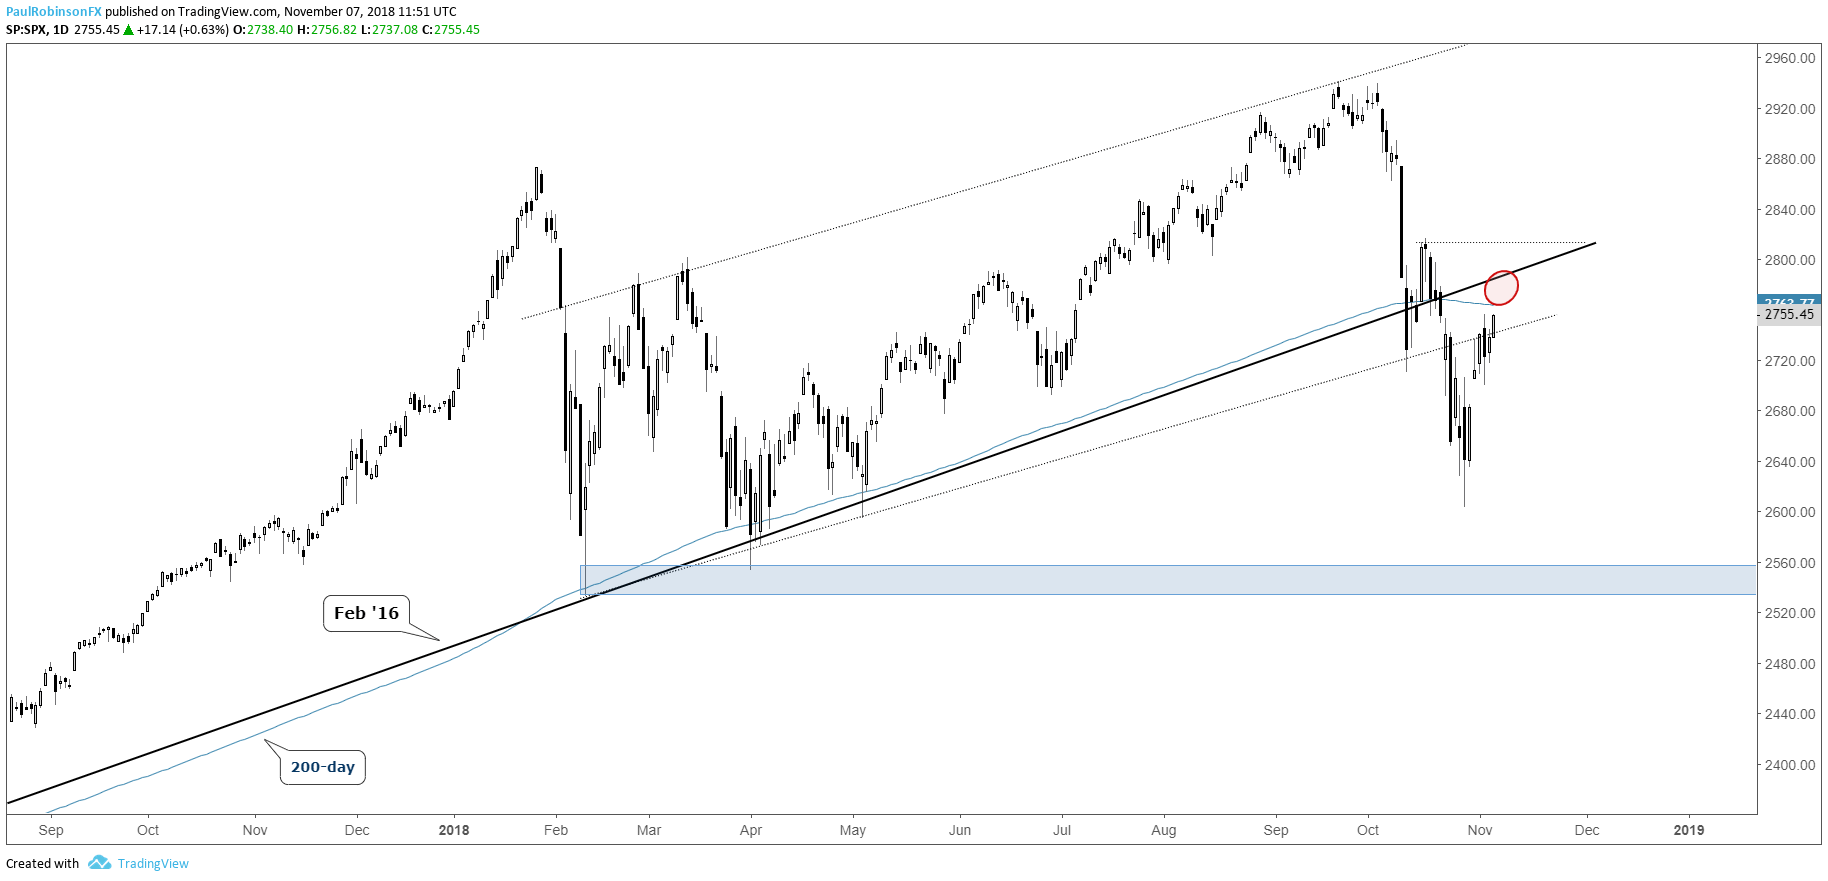
The S&P will start out today testing a really big area via the 200-day and February 2016 trend-line combo. It’s an important test for sure, as it could be the last one before another swoon sets in. If the market can overcome this big hurdle then it has a chance at continuing to rally. Indeed, this time right now is considered big for the outlook of stocks.
S&P 500 Daily Chart (200-day, Feb ’16 t-line test)
For our intermediate-term fundamental and technical take, see the Q4 Global Equities Forecast
DAX 30 caught between pattern/trend and long-term support
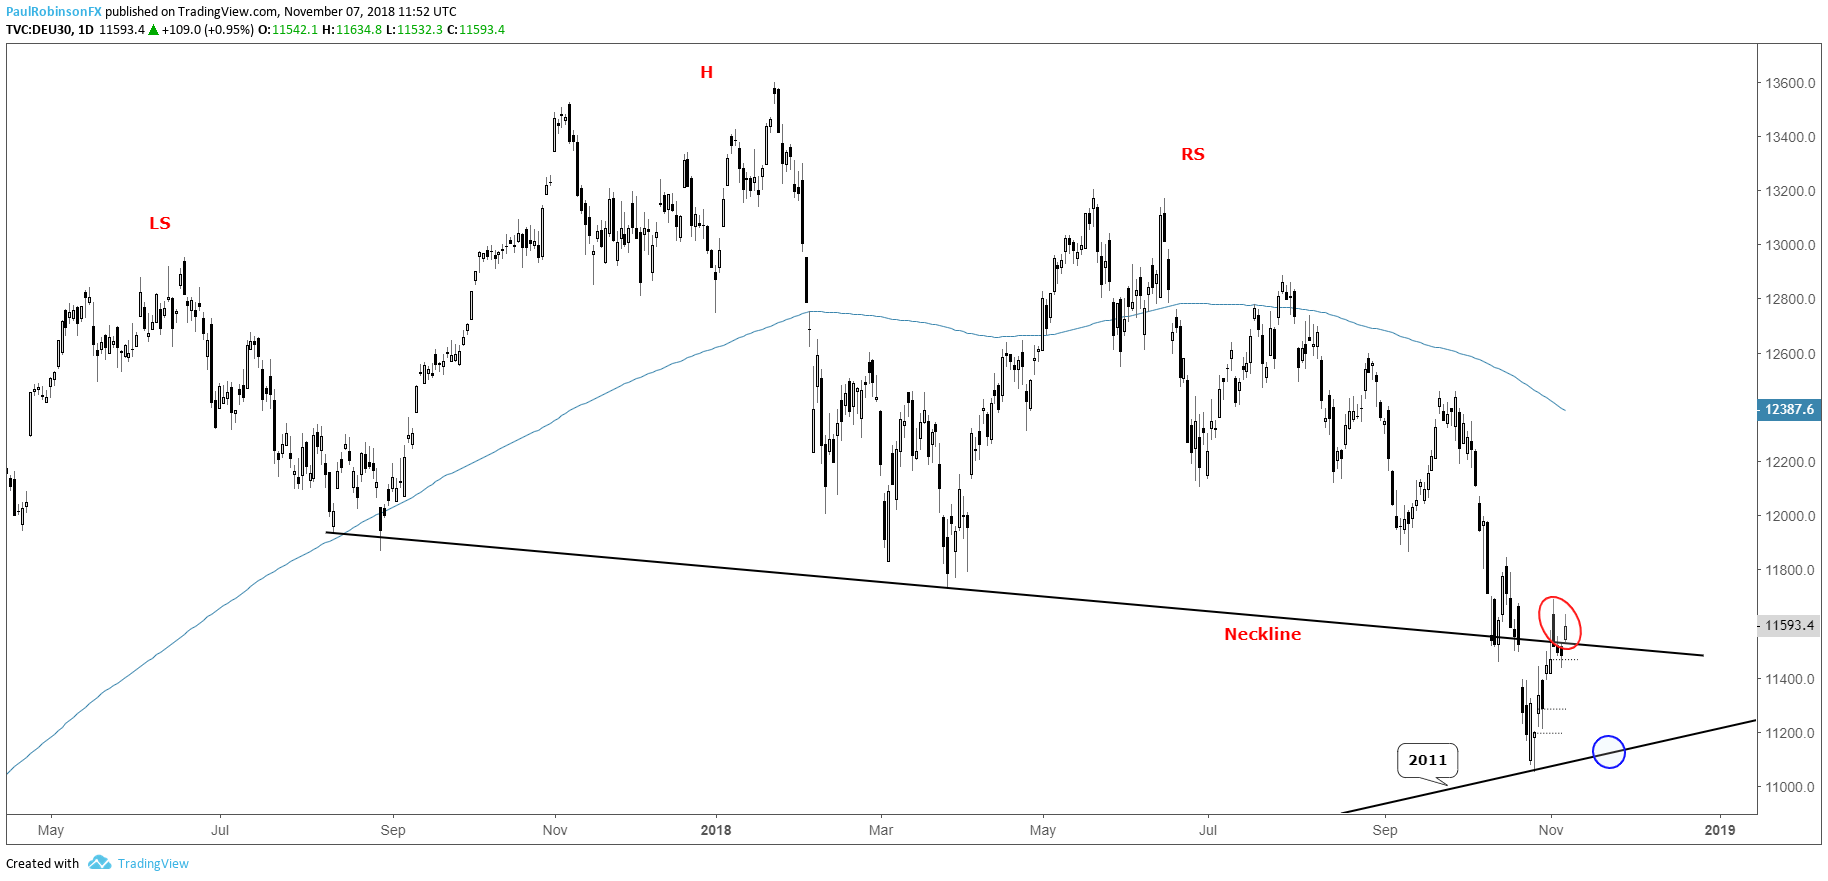
The DAX is caught up between the general downtrend/head-and-shoulders neckline break and the 2011 trend-line. It’s a battle of long-term forces. Looking shorter-term at the hourly chart, the DAX may be putting in an inverse head-and-shoulders. It will need to trade above the neckline to validate, but it could at the least blow some life into the German benchmark up towards 12k.
DAX Daily Chart (between neckline & 2011 t-line)
DAX Hourly Chart (Inverse H&S potential)

Resources for Index & Commodity Traders
Whether you are a new or an experienced trader, DailyFX has several resources available to help you; indicator for tracking trader sentiment, quarterly trading forecasts, analytical and educational webinars held daily, and trading guides to help you improve trading performance.
We also have a series of guides for those looking to trade specific markets, such as the S&P 500, Dow, DAX, gold, silver, crude oil, and copper.
---Written by Paul Robinson, Market Analyst
You can follow Paul on Twitter at @PaulRobinsonFX


