


Gold coming off resistance quickly has price support in focus, but looks more likely to head towards the next level (line in this case) of support. The drop in crude oil may be over soon, but a rally looks likley to prove only corrective in what looks to be a broader move lower. The Dow Jones has been holding up better than the SPX and NDX, and so far is holding trend support from 2016. The DAX 30 is caught between a break of the long-term head-and-shoulders pattern and significant trend support.
Technical Highlights:
- Gold has a couple of support areas to watch
- Crude oil may find some buyers, bounce not expected to last
- Dow Jones holding longer-term trend support for now
- DAX 30 caught between two strong levels
See how the majority of traders are positioned in various markets/currencies and what it says about future price fluctuations – IG Client Sentiment
Gold has a couple of support areas to watch
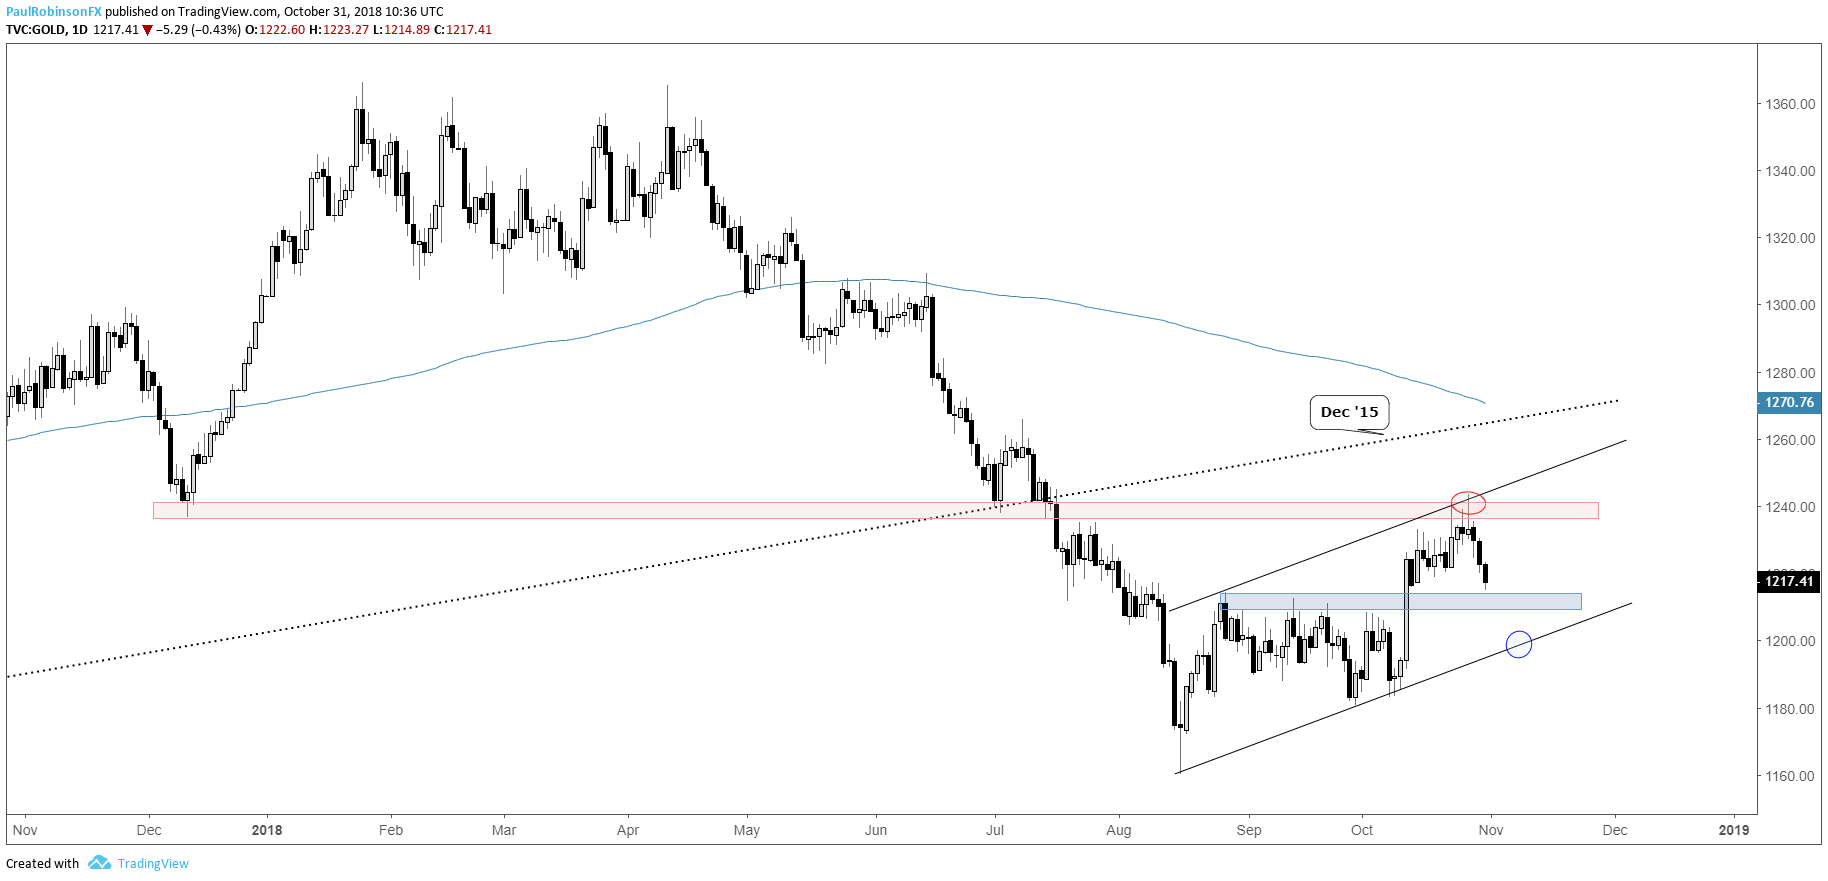
Gold’s turn down from the 1240 area has support in focus around 1214/10, the top part of the range during August into the early part of this month. If sellers show up in earnest the next likely spot of support will come at the lower parallel of the channel off the August low. Right now the thinking is that the lower threshold will get tested. Silver is heading lower out of a bear-flag, with the August low and worse targeted.
Gold Daily Chart (support levels below)
For our intermediate-term fundamental and technical take, see the Q4 Gold Forecast
Crude oil may find some buyers, bounce not expected to last
Yesterday, crude oil turned higher off a trend-line from summer but has yet to thoroughly test lows over the past few months. At some point soon a bounce could develop, but that is all it will be viewed as at this time. The broader picture has turned negative with breaks of the July slope and June trend-line from last year following a turn down off the 2008 trend-line and lows from 2011/12. A retest of those broken lines from 2017 could make for a good spot to look for oil to resume lower after correcting.
Crude Oil Daily Chart (May bounce but be short-lived)

For our intermediate-term fundamental and technical take, see the Q4 Crude Oil Forecast
Dow Jones holding longer-term trend support for now
The Dow Jones, unlike the S&P 500 and Nasdaq 100, is still holding trend support from 2016. This keeps the index supported for now, but not expected to last. There is the underside of a trend-line running over from April just ahead, along with the 200-day MA. This area could make for a good spot for short-term shorts to look to sell if met and momentum turns back lower. Markets are volatile right now, so being flexible and nimble here is key.
Dow Jones Daily Chart (holding Feb 2016 t-line for now)

For our intermediate-term fundamental and technical take, see the Q4 Global Equities Forecast
DAX 30 caught between two strong levels
The DAX is coming off a test of the 2011 trend-line, but now about to face off with the neckline of the head-and-shoulders pattern recently triggered. The neckline was broken on a gap at 11524. A turn down from resistance may offer an attractive short entry for another test of the 2011 trend-line. We could see some bouncing around between these two big thresholds, but should we see the 2011 trend-line break at some point the DAX is seen as being in for a big decline.
DAX Daily Chart (between neckline & 2011 t-line)

Resources for Index & Commodity Traders
Whether you are a new or an experienced trader, DailyFX has several resources available to help you; indicator for tracking trader sentiment, quarterly trading forecasts, analytical and educational webinars held daily, and trading guides to help you improve trading performance.We also have a series of guides for those looking to trade specific markets, such as the S&P 500, Dow, DAX, gold, silver, crude oil, and copper.
---Written by Paul Robinson, Market Analyst
You can follow Paul on Twitter at @PaulRobinsonFX


