


EURUSD reached our target of 1.1450-1.1500. Minimum expectations are met for the dip and a bull rally may begin from nearby levels.
The video above is a recording of a US Opening Bell webinar from October 8, 2018. We focused on the Elliott Wave and patterns for many USD forex markets like EURUSD, Dollar Index, GBPUSD, AUDUSD, USDCHF and others like natural gas. USD has satisfied near term expectations for strength and may embark upon several weeks of weakness.
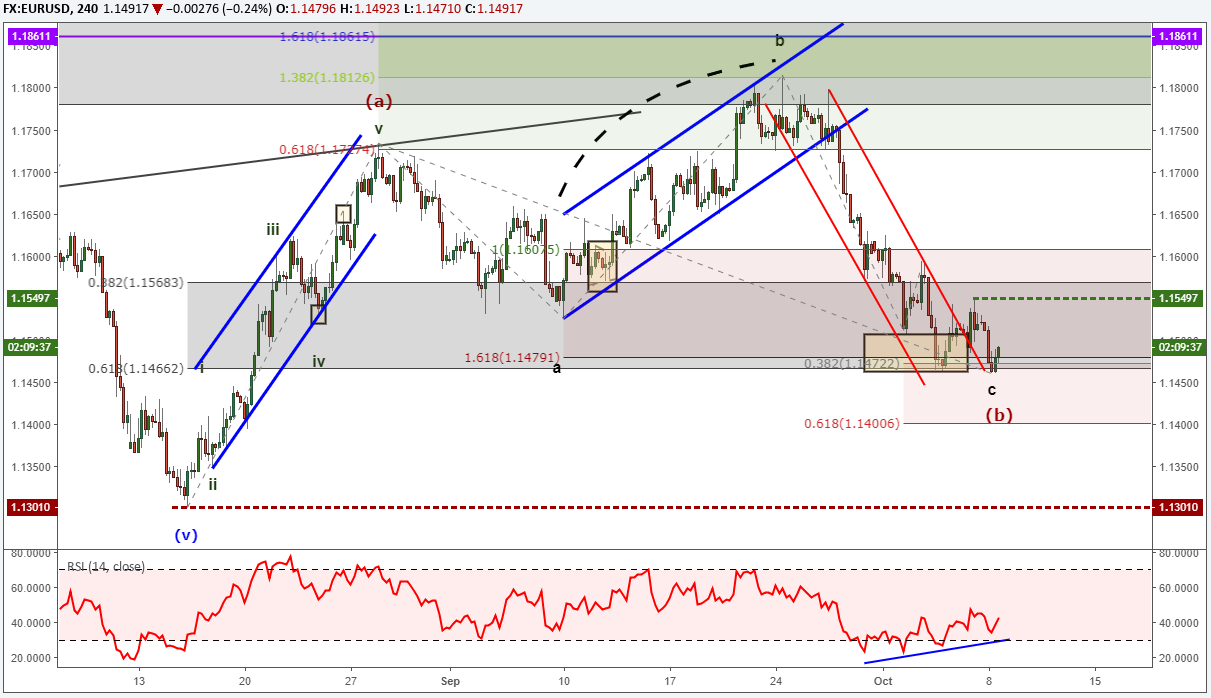
EURUSD Elliott Wave Chart Shows an up wave may begin from nearby levels
For the past month, we have been warning of an eventual dip to 1.1450-1.1500 in EURUSD. Now that price has entered this zone, what is next for EURUSD?
The Elliott Wave picture we are following is that EURUSD is about to begin wave (c) of an (a)-(b)-(c) zigzag pattern higher. If this wave begins from nearby levels, then EURUSD may run to 1.19-1.22 in the coming weeks.
We anticipate this move higher will be an impulse wave or diagonal pattern. If the pattern is successful in developing, then we can more identify the potential for a topping level as we approach it.
Sentiment has shifted towards the positive which signals a bear run. Current live sentiment for EURUSD is +1.40.
There is another wave count that could drive EURUSD to 1.12 to 1.14, but this sell off would be temporary prior to embarking upon another bullish run up to 1.18. The higher probability Elliott Wave counts we are following hint at an eventual test of 1.20-1.22. Whether that run starts from current levels or slightly lower levels has yet to unfold.
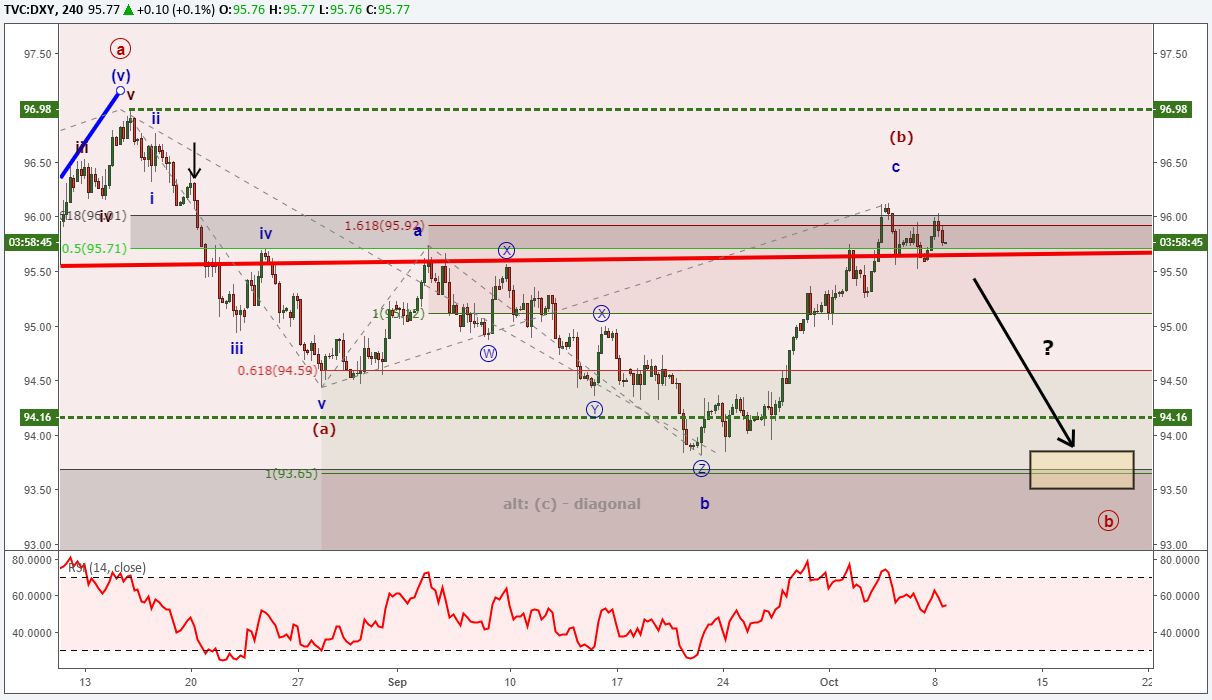
Dollar Index Eyes a Retest of 93.80
Circle wave ‘b’ continues to unfold to the downside. It appears the current Elliott Wave for US Dollar Index is that wave (b) of circle ‘b’ has just finished. That means wave (c) of circle ‘b’ is getting ready to begin.
Since August 27, we have been forecasting a US Dollar Index rebound to above 95.70. So long as DXY remains below 96.98, then we can anticipate a bearish run to press below 93.80 and possibly to 92.
USDCHF Elliott Wave Chart Hints at reversal back to 9750-9850
USDCHF has shifted from rocketing higher to a steadier orbit. Since USDCHF pressed slightly above our 9870-9880 zone without hesitation, the alternate wave picture is recognized as a higher probability outcome. That is to say, the bearish impulse wave from July 2018 to September 2018 may be the ‘c’ wave of a bearish flat correction that began May 2018.
Whether the bearish impulse is the start of a new downtrend or whether if finished the downtrend, the recovery from the September 21 low has matured to the point a consolidation to 9750-9850 is higher probability. Depending on the structure of the correction will help us tip the scales as the preferred wave count at higher degree.

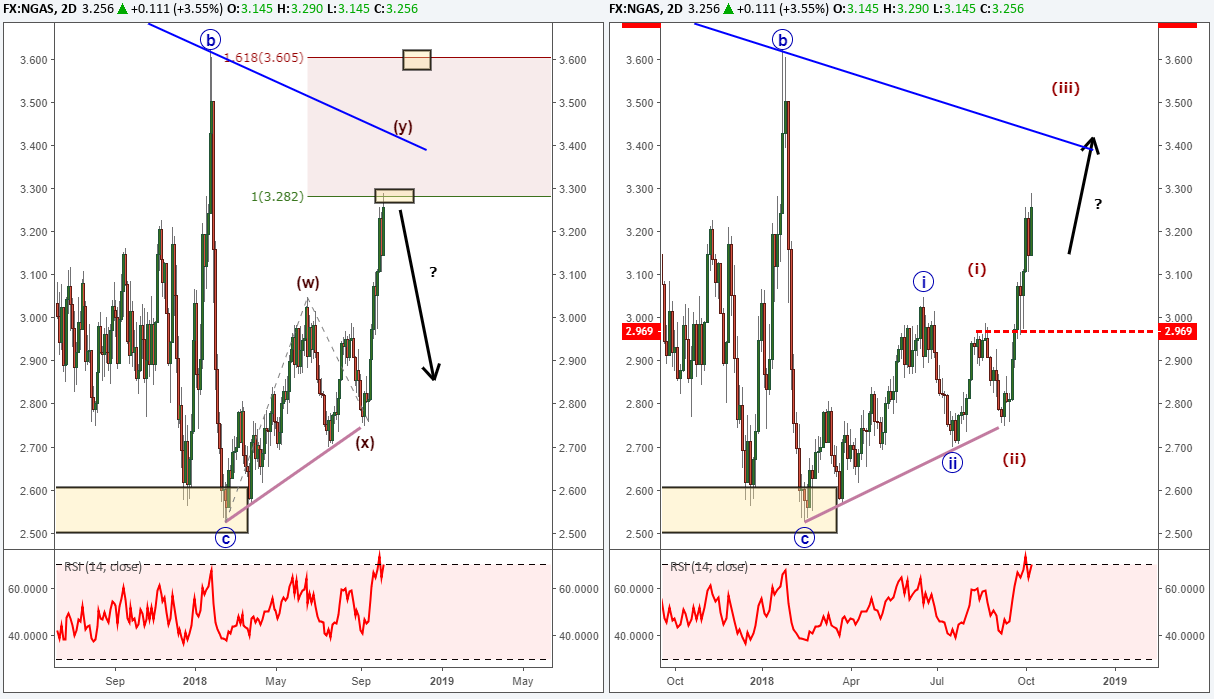
Natural Gas Prices Blow higher
Natural gas prices have increased nearly 19% in the past 3 weeks. We wrote last week how the natural gas chart was mixed and that price behavior near 3.28 may allow us to favor the sideways or bearish picture. If natural gas prices continue to accelerate above 3.28 without pause, then we will more strongly consider the bullish alternative on the right side of the split chart.
Bottom line, natural gas is approaching a pivot level that can tip the scales in favor of one Elliott wave count versus the other.
Elliott Wave Theory FAQ
How does Elliott Wave theory work?
Elliott Wave theory is a trading study that identifies the highs and lows of price movements on charts via wave patterns. Traders analyze the waves for 5-wave moves and 3-wave corrections to determine where the market is at within the larger pattern. Additionally, the theory maintains three rules and several guidelines on the depth of the waves related to one another. Therefore, it is common to use Fibonacci with Elliott Wave analysis. We cover these topics in our beginners and advanced Elliott Wave trading guides.
After reviewing the guides above, be sure to follow future Elliott Wave articles to see Elliott Wave Theory in action.
---Written by Jeremy Wagner, CEWA-M
Jeremy Wagner is a Certified Elliott Wave Analyst with a Master’s designation. Jeremy provides Elliott Wave analysis on key markets as well as Elliott Wave educational resources. Read more of Jeremy’s Elliott Wave reports via his bio page.
Communicate with Jeremy and have your shout below by posting in the comments area. Feel free to include your Elliott Wave count as well.
Discuss these markets with Jeremy in Monday’s US Opening Bell webinar.
Follow me on Twitter at @JWagnerFXTrader .


