


Talking Points:
- Trading in the Australian and New Zealand these past three trading days relative to the whole month its lows comparable to Jan 1
- Though distorted in its relationship to risk trends and carry trade, the Aussie Dollar still has a catalyst in China-relations
- Similarly knocked off its carry trade perch, the New Zealand Dollar may find its guidelines from local data: 2Q NZ GDP
It's Quiet...A Little Too Quiet
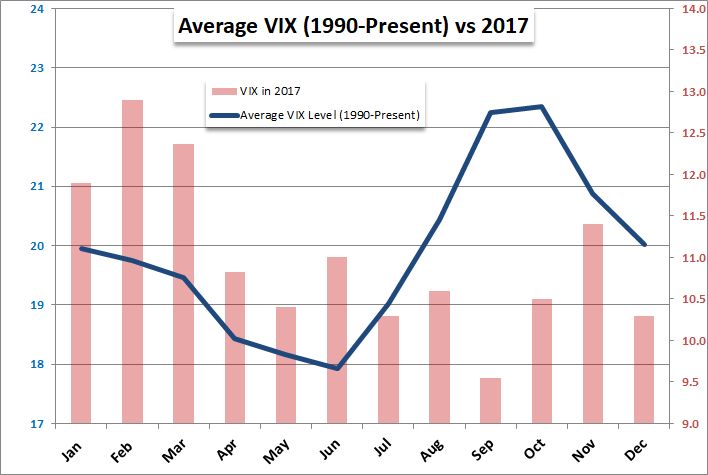
As the saying goes: 'it's quiet...a little too quiet'. Exceptionally deflated levels of market activity are commonplace across the financial system at present. Remarkable quiet is not particularly unfamiliar as of late however. The levels of inactivity through 2017 were exceptional in both the degree of restraint and the persistence of the quiet. The number of days the VIX dropped below 10 through the latter half of the year was a multiple of the aggregate for all the years that preceded the remarkable period. Such low volatility readings are an aberration. They clearly can exist under the correct environment, but they should not persist so long as markets revert to norms. As we register a slide in implied volatility readings - whose value is derived for the price investors are willing to pay for hedges - as well as purely-price based indicators such as the Average True Range (ATR), it is important to differentiate our conditions today from those of last year. Though there were fundamental issues looming over the markets last year, they were not 'activated'. Presently, there are a host of high-profile themes - from trade wars to monetary policy reversal to a stall in growth trends - which is keeping an uneasy balance between conflicting extremes. Quiet may prevail at present, but don't base any trades around this deflated market conditions.
VIX Seasonal Chart
The Australian Dollar as a China Proxy
In registering the low activity levels in the FX market, the Australian Dollar presents one of the more remarkably constrained pictures of the majors. Despite the currency's slide these past six to seven months, more recent activity levels have proven surprisingly constrained. There are many ways to measure volatility, but a useful 'relative' means is to look at a more recent ATR compared to a standard medium-term duration. The ratio of the 3-day to 20-day (intra-week to one trading month) ATR ratio for an equally-weighted Australian Dollar Index dropped Monday to its lowest level since January 1 - a period that was clearly defined by holiday trade. We have to rewind multiple years to get comparable readings outside of these levels. In other words, conditions are overtly extreme and likely to revert to a mean. For the Australian currency, volatility is likely to arise through trade wars. Where the Yuan is a poor measure of trade wars - even between the US and China - owing to the distortion presented by Chinese policy authorities, there is no such buffer for Australia. That said, there is an obvious economic connection between the two countries due to the countries dependency on Chinese demand. Given the circumstances, further decline is the more likely trend for the AUD, but the options are rather thin. An unexpected reversal for this wayward carry currency would be flush with options.
AUD Index Chart (Daily)

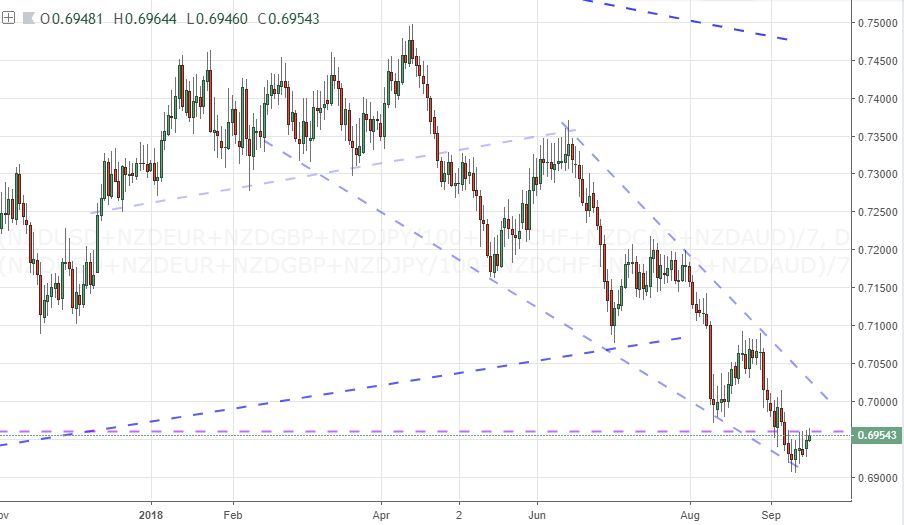
A Kiwi Dollar-China Connection but NZ GDP for Complication
Though the Australian Dollar is the better measure of the US-China trade war spillover, the New Zealand Dollar is not absolved of its own connections to the region's economic giant. Rather than raw materials in the form of industrial metals and energy products, New Zealand ships agricultural goods to China. It is still a clear economic dependency for a country that puts considerable weight in its export industry and has seen its carry appeal eviscerated by the RBNZ's rate cuts. If China's economy flounders owing to the escalation in tariffs by the United States (taxes on another $200 billion in Chinese imports), the Kiwi will feel the pinch. That said, this currency carries even more distinct connection to its own floundering fundamental position. The RBNZ's 'jawboning' to drive its currency lower has not worked on-demand, but it has squashed any early hope of carry appetite return. High level data may feed into the same box. Coming up Wednesday evening / Thursday morning is the country's 2Q GDP report. This may not register as a global catalyst, but it can certainly leverage a significant move from the most reserved level of price action from the New Zealand currency since holiday trade. Once again, chose your options and scenarios wisely. We focus in on the extreme levels of quiet behind the Australian and New Zealand Dollar in today's Quick Take Video.
NZD Index Chart (Daily)
Written by John Kicklighter, Chief Currency Strategist for DailyFX.com


