


Tomorrow brings the release of Non-Farm Payrolls out of the United States for the month of August, and the expectation is for +193k jobs to have been added to go along with a 3.8% unemployment rate, and a .2% gain in Average Hourly Earnings (at a 2.7% annualized clip). The Average Hourly Earnings portion of the report will likely receive considerable attention given the expected rate hike out of the Fed later in the month, combined with another possible move later in the year in December.
The September rate decision is currently carrying a 99% probability of a hike. So it would probably be far more of a disappointment if we did not get a hike out of the Fed later this month. But December is more questionable, as we’re currently seeing 67% odds of another 25 basis point adjustment, and a continuation of strong US data could push this closer to 90% which could bring USD strength along with it.
In this webinar, we used price action to look at macro markets ahead of tomorrow’s release. We looked at a series of setups across the US Dollar, as well as a few equity indices that we had previously discussed in this week’s equities forecast.
Talking Points:
- If you’re looking to improve your trading approach, our Traits of Successful Traders research could help. This is based on research derived from actual results from real traders, and this is available to any trader completely free-of-charge.
- If you’re looking for a primer on the FX market, we can help. To get a ground-up explanation behind the Forex market, please click here to access our New to FX Trading Guide.
If you’d like to sign up for our webinars, we host an event on Tuesday and Thursday, each of which can be accessed from the below links:
Tuesday: Tuesday, 1PM ET
Thursday: Thursday 1PM ET
US Dollar Building Bearish Case as Bulls Go on Hiatus
We started off by looking at the US Dollar, which is still holding on to the bullish theme that started in April: But that bullish case is fast deteriorating as the US Dollar has been unable to hold on to any flares of strength over the past few weeks. A big push point here appears to be the Euro and along with it, risk aversion.
Yesterday morning we looked at another failed run of strength in USD when sellers came back off of the June and July highs. With prices pegged back to the 95.00 psychological level, which was the May swing high, we basically have two months of strength followed by four months of range. And as the upward bias that had held through the bulk of that range comes into question, so does the sustainability of the prior bullish move. At this point we have the US Dollar grasping onto support, so bullish themes can remain; but we may soon be looking at the other side of the coin.
US Dollar Daily Price Chart
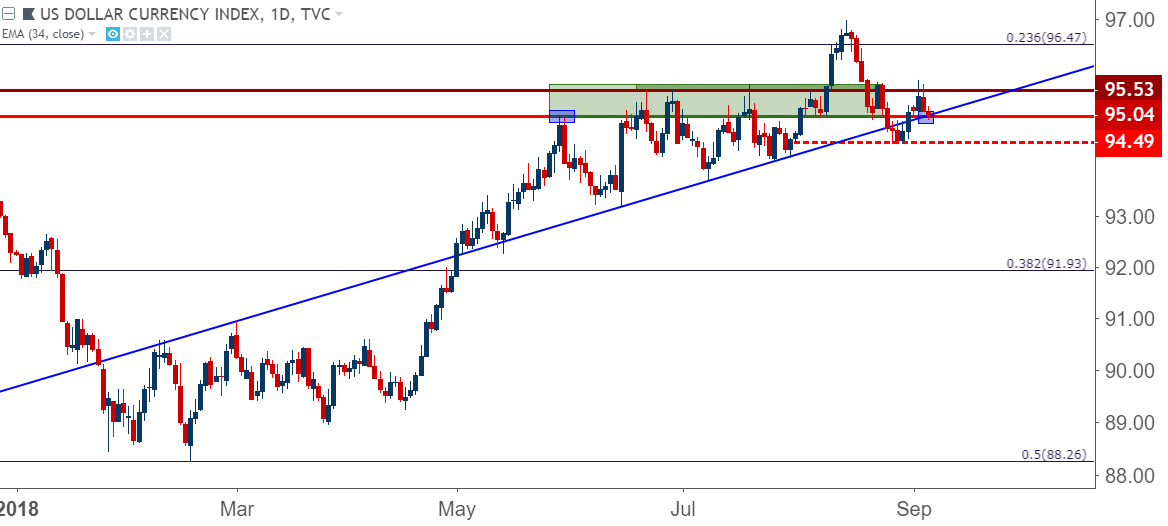
Chart prepared by James Stanley
EUR/USD
It was a busy August for the Euro, but the majority of that move was erased by the time we closed the month. There has been little by way of positivity around the Euro-Zone so far this year. The ECB was in a challenging spot as the currency continued to surge coming into 2018, but a respite was seen in late-April when EUR/USD pulled back to the 1.2000’s following the ECB rate decision. The real heat started to show in May as Italian politics took center-stage, and at that point EUR/USD made a quick run down to 1.1509 at which point prices just stalled.
That Euro weakness gave the ECB some operating room to announce stimulus taper in the month of June; and when that happened, EUR/USD merely went down for a re-test of 1.1509. It wasn’t until early-August that the pair had the motivation to break through 1.1500, but even then, it was a fleeting theme. As prices caught support in the middle of last month, bulls took over and drove for the next two weeks, bringing prices back to a key zone of resistance that runs from 1.1709-1.1750.
EUR/USD Daily Price Chart: July Resistance Holds the Highs

Chart prepared by James Stanley
At this stage, bulls have shown no signs of yet letting up, coming back in to offer support above the 1.1500 handle. As we’ve been following, the resistance area around 1.1709-1.1750 appears to be key, and a topside break above that area re-opens the door for bullish strategies. But – until then and much like we looked at in the US Dollar, price action keeps the door open for continuation.
EUR/USD Four-Hour Price Chart

Chart prepared by James Stanley
GBP/USD: Applying Buffers to Account for Enhanced Volatility
Cable has gotten a bit more chaotic over the past couple of weeks, and making matters a bit more vexing is the fact that much of the drive appears to be emanating off of Brexit-driven headlines. We looked into the matter yesterday, and we remarked that given some of the short-term volatility that’s crept into the pair, taking a step back to look for a more confirmed setup seemed to be a reasonable way to approach matters. We reiterated that on this webinar, looking for prices to pose a test of fresh highs before looking to catch higher-low support at prior resistance.
GBP/USD Four-Hour Price Chart

Chart prepared by James Stanley
AUD/USD: Possible Support Play Brewing
We looked at reversal plays off of a big zone of support in AUD/USD in mid-August, and we have a similar such scenario in the early portion of September. Prices have spent much of the past two days trading back-and-forth around this long-term area of support. On a shorter-term basis, this has produced and ascending triangle formation, which can often be approached for topside breakouts. We looked into that setup, and this could be one of the more attractive short-side USD candidates.
AUD/USD Hourly Price Chart; Attempting to Build Support Near Yearly Lows

Chart prepared by James Stanley
USD/CHF for Bearish USD Continuation
We’ve been following USD/CHF for bearish USD approaches, and that theme remains as attractive as we move deeper into September. At this stage, prices are testing recent lows around .9650, and chasing the move lower is unattractive at current levels. This could be greatly helped by a flare of USD-strength around tomorrow’s NFP report, looking for lower-high resistance inside of this week’s swing high.
USD/CHF Four-Hour Price Chart
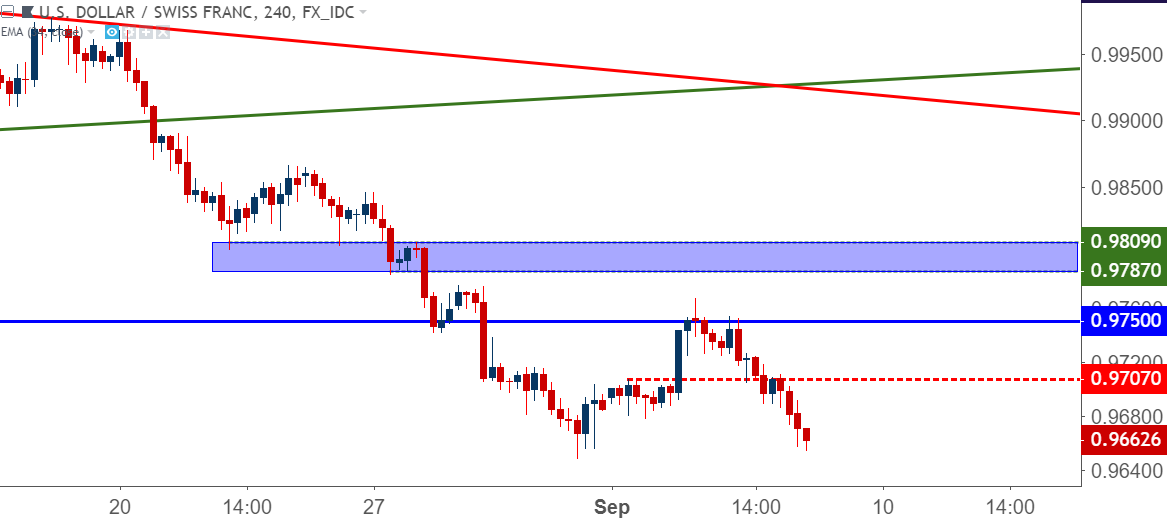
Chart prepared by James Stanley
DAX Breakdown Nearing Big Support
We looked at bearish themes in the DAX ahead of this week’s open, as the weekly chart had started to budge below a big area of support ahead of the August close. We’re looking for prices to move back down towards 2018 lows, and this takes place around the 38.2% retracement of the 2016-2018 major move in the index. Support here opens the door for a bounce, at which point targets/resistance could be sought at prior areas of support such as 12,100.
DAX Weekly Price Chart
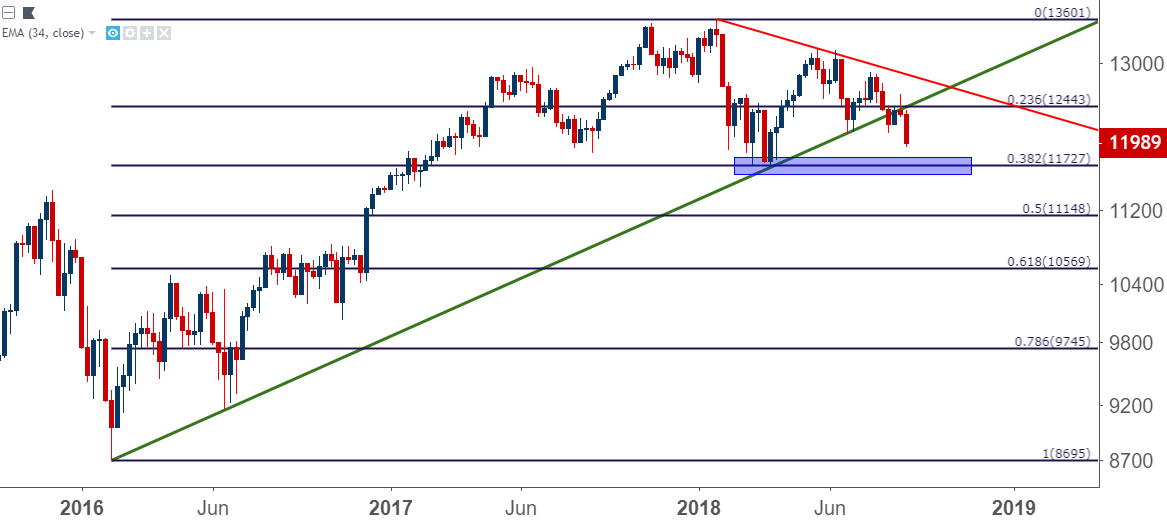
Chart prepared by James Stanley
FTSE 100 Really Doesn’t Like 7775
UK equities are in breakdown at this stage, and we’d looked for a bearish move coming into this week. We were looking for a re-test of the 50% marker of the major move that started in March, and that objective has already been met. Prices appear to be on their way to the 61.8% interval, and if a bounce develops here, bearish positions can become attractive again on the prospect of resistance at prior support around 7375.
FTSE 100 Daily Price Chart
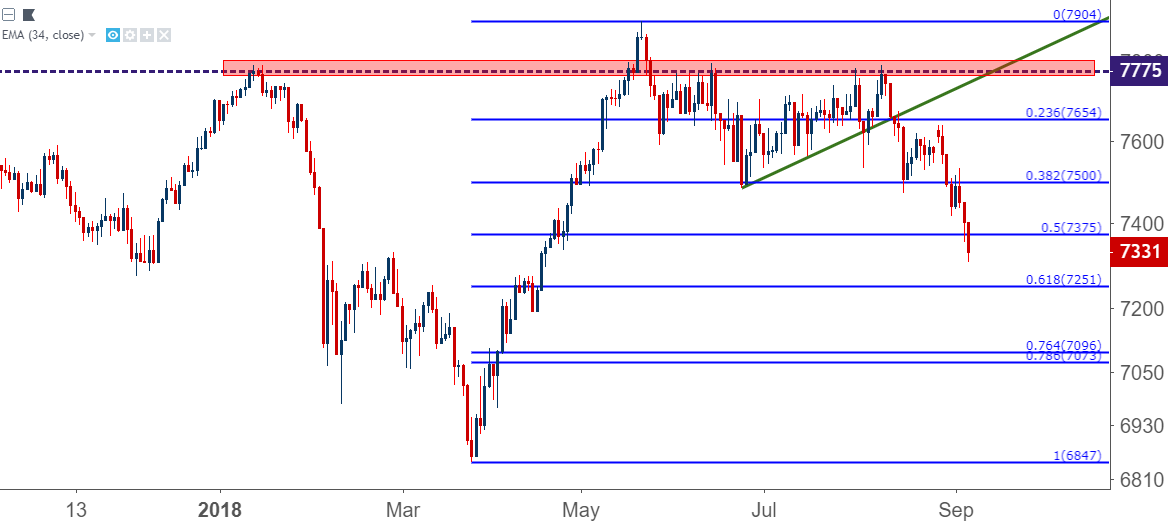
Chart prepared by James Stanley
To read more:
Are you looking for longer-term analysis on the U.S. Dollar? Our DailyFX Forecasts for Q1 have a section for each major currency, and we also offer a plethora of resources on USD-pairs such as EUR/USD, GBP/USD, USD/JPY, AUD/USD. Traders can also stay up with near-term positioning via our IG Client Sentiment Indicator.
Forex Trading Resources
DailyFX offers a plethora of tools, indicators and resources to help traders. For those looking for trading ideas, our IG Client Sentiment shows the positioning of retail traders with actual live trades and positions. Our trading guides bring our DailyFX Quarterly Forecasts and our Top Trading Opportunities; and our real-time news feed has intra-day interactions from the DailyFX team. And if you’re looking for real-time analysis, our DailyFX Webinars offer numerous sessions each week in which you can see how and why we’re looking at what we’re looking at.
If you’re looking for educational information, our New to FX guide is there to help new(er) traders while our Traits of Successful Traders research is built to help sharpen the skill set by focusing on risk and trade management.
--- Written by James Stanley, Strategist for DailyFX.com
Contact and follow James on Twitter: @JStanleyFX


