


The US Dollar Index (DXY) broke an important support line yesterday but held on by the close; just a temporary hold of support or a low of the move? The euro and cable are in focus as one looks to do the opposite of DXY and the other potentially carves out a bullish sequence. Gold is pulling back, watching to see if another higher low can form soon.
Technical Highlights:
- US Dollar Index (DXY) teetering on support
- EUR/USD looking opposite DXY as expected
- GBP/USD developing a bottoming pattern
- Gold pulling back, watching for signs of another higher low
To check out our intermediate-term fundamental and technical outlook on major markets and currencies, see the Q3 Trading Forecasts.
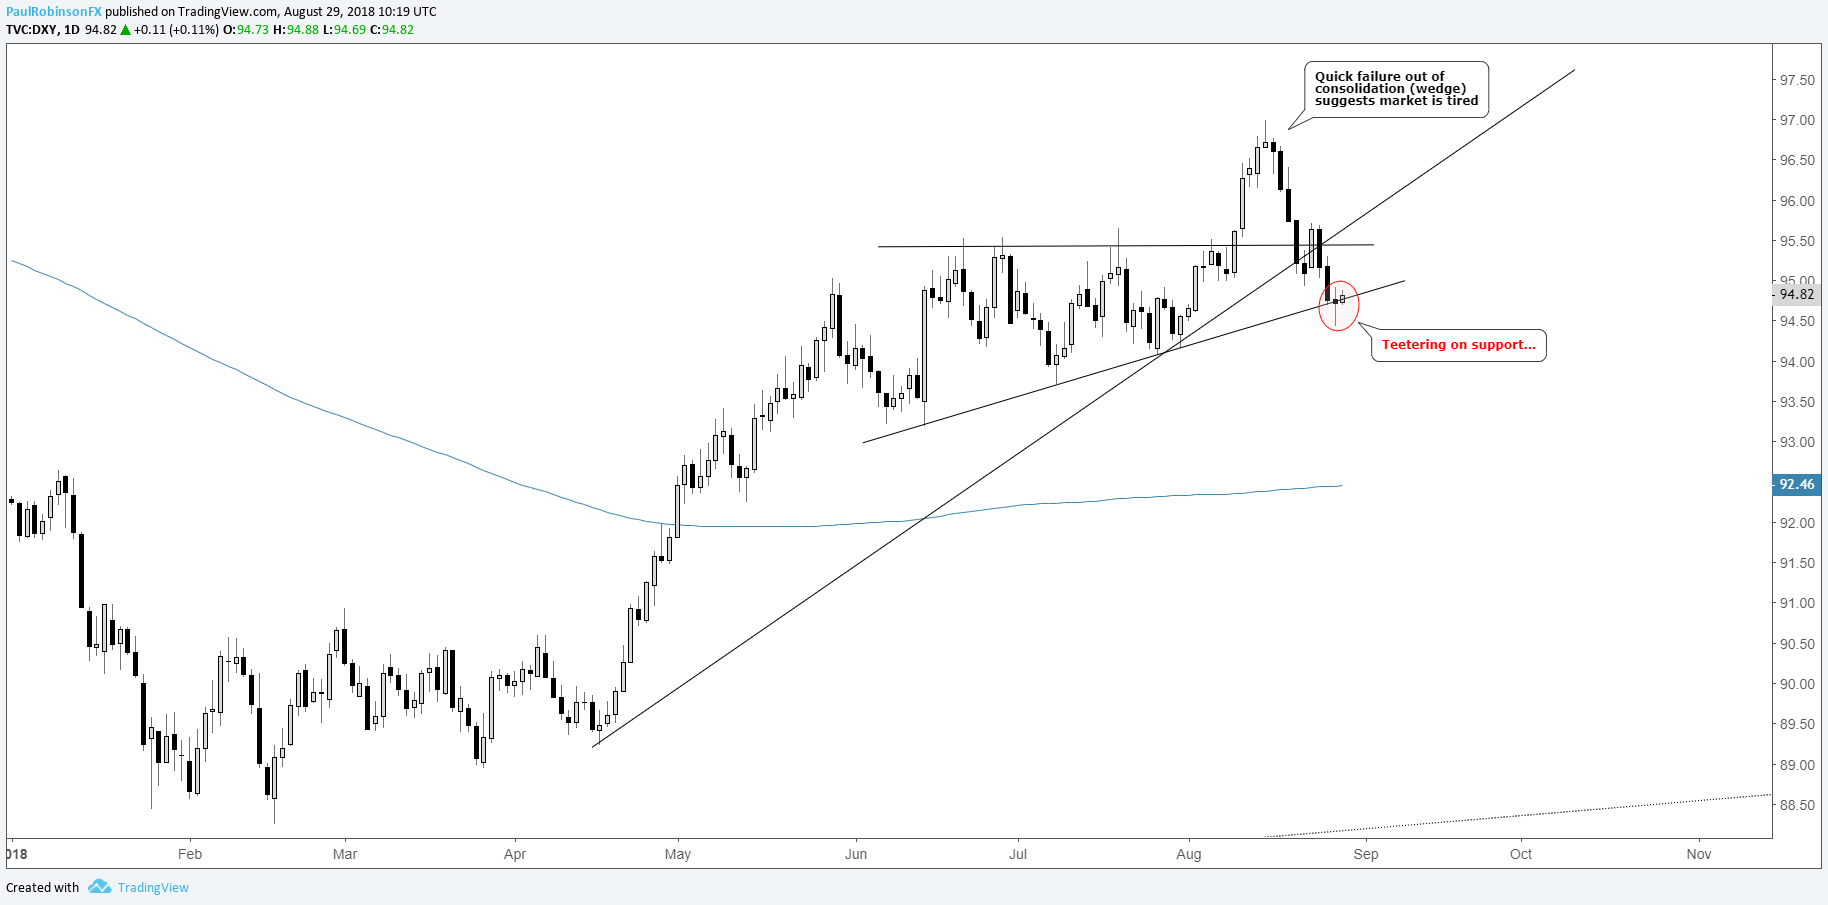
US Dollar Index (DXY) teetering on support
The US Dollar Index (DXY) traded below support yesterday on an intra-basis, but by the close of the session it posted a smallish bullish reversal. It wasn’t the most inspiring turnaround, but nevertheless it suggests support may hold for now.
As we discussed last week, the quick reversal following the breakout from the June-August consolidation period suggests the dollar is on the verge of a broader reversal. The lower trend-line (making up the bottom line of the consolidation wedge) is viewed as important should it break, likely leading to another acceleration in selling. For now, we’ll respect it as support but it may not last long…
US Dollar Index (DXY) Daily Chart (Teetering on support)
Check out the Q3 US Dollar Forecast for a broader fundamental and technical view.
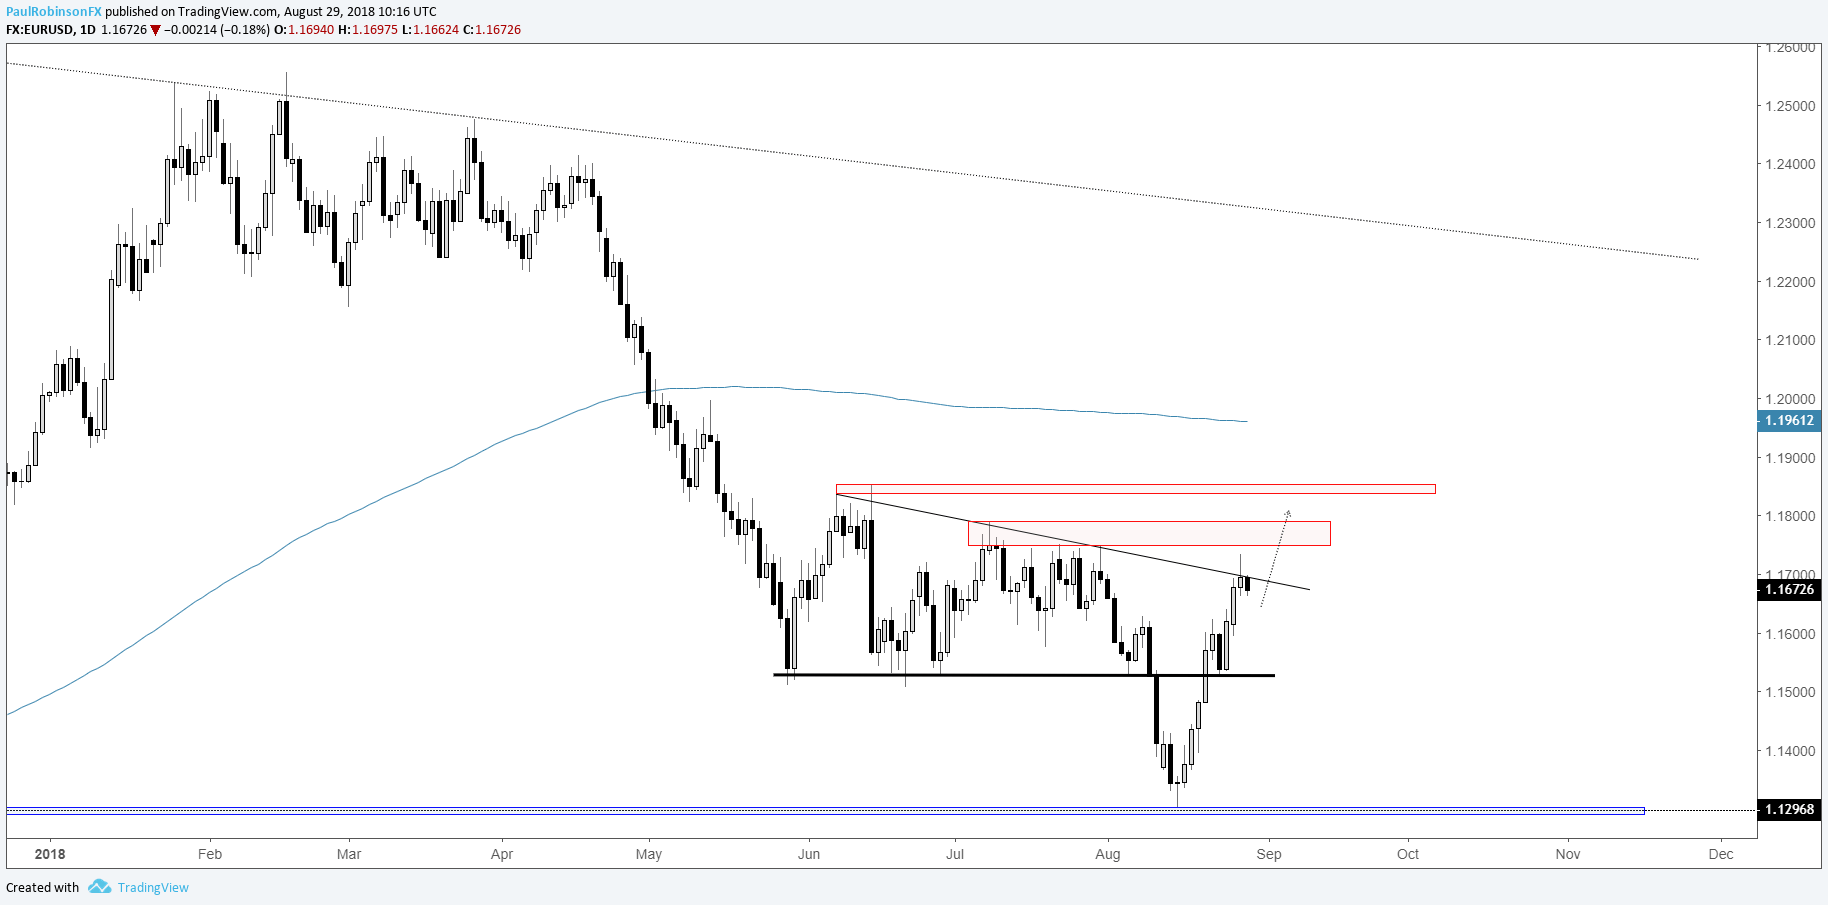
EUR/USD looking opposite DXY as expected
The euro is largely driving the price action behind the DXY with its hefty 57% weighting in the index. It then unsurprisingly turned down from the same wedge pattern t-line. This is viewed as more-likely-than-not to lead to a minor pullback/consolidation before driving higher. There is resistance in the 11700s to contend with, but may not prove overly problematic if recent momentum can continue.
EUR/USD Daily Chart
Check out the Q3 Euro Forecast for a broader fundamental and technical view.
GBP/USD developing a bottoming pattern
Cable has been one we’ve been staying away from as a long candidate given its generally poor posturing, however; sentiment is changing. Dialing in to the 4-hr time-frame, an ascending wedge is coming into play with the trend-line off the mid-month low supportive. A little more time could have the top-side of the pattern broken soon and a larger rebound in store.
GBP/USD 4-hr Chart (Possible ascending wedge)

Check out the Q3 Pound Forecast for a broader fundamental and technical view.
Gold pulling back, watching for signs of another higher low
In yesterday’s webinar, we discussed gold as still having a generally constructive outlook with more oversold to be worked off in the near-term. But ideally, we want to see a pullback first before re-establishing bullish bets. The downturn we are seeing now could provide that opportunity. The 4-hr is giving us a good look at the lower parallel of a channel off the low, a touch of this line and thorough test of the prior peak could offer good risk/reward for would-be longs.
Gold 4-hr Chart (Channel support for higher low)

Check out the Q3 Gold Forecast for a broader fundamental and technical view
Resources for Index & Commodity Traders
Whether you are a new or an experienced trader, DailyFX has several resources available to help you; indicator for tracking trader sentiment, quarterly trading forecasts, analytical and educational webinars held daily, trading guides to help you improve trading performance, and one specifically for those who are new to forex.
---Written by Paul Robinson, Market Analyst
You can follow Paul on Twitter at @PaulRobinsonFX


