


In this webinar, we used price action to look at macro markets as the US Dollar has continued to slide below previously established support. As we discussed, the move of USD-weakness appears to be unevenly distributed, with bounce in EUR/USD showing a bit more vigor than the USD-weakness that’s shown against GBP/USD or AUD/USD. While both Cable and Aussie are trading well-below prior August highs, EUR/USD has erased all of the August losses and is now trading at fresh monthly highs. We looked at the monthly price chart of EUR/USD working on a hammer formation, which can often show up after capitulation takes place following a fresh low.
Talking Points:
- If you’re looking to improve your trading approach, our Traits of Successful Traders research could help. This is based on research derived from actual results from real traders, and this is available to any trader completely free-of-charge.
- If you’re looking for a primer on the FX market, we can help. To get a ground-up explanation behind the Forex market, please click here to access our New to FX Trading Guide.
If you’d like to sign up for our webinars, we host an event on Tuesday and Thursday, each of which can be accessed from the below links:
Tuesday: Tuesday, 1PM ET
Thursday: Thursday 1PM ET
US Dollar Breaks June-July Bullish Trend-Line, Bounces From August Lows
The bearish theme in the US Dollar has continued as we move towards the close of August, and it’s been a climactic month so far for the Greenback. After coming into August with a full head of steam, the currency spent the first two weeks surging up to fresh highs, eventually testing above the Fibonacci level at 96.47 for a day-and-a-half. But that strength was soon faded out of the market, and the second half of the month has seen the entirety of those gains erased and then some. On the weekly chart, this built-into an evening star formation, as we looked at in our FX Setups of the Week. As I shared, I wasn’t looking for bearish scenarios for the Greenback until support was taken-out; but now that this has happened, the door has to be re-opened to the possibility of continued weakness.
US Dollar Four-Hour Price Chart: Bounce From August Lows Opens Door for Resistance at Prior Support
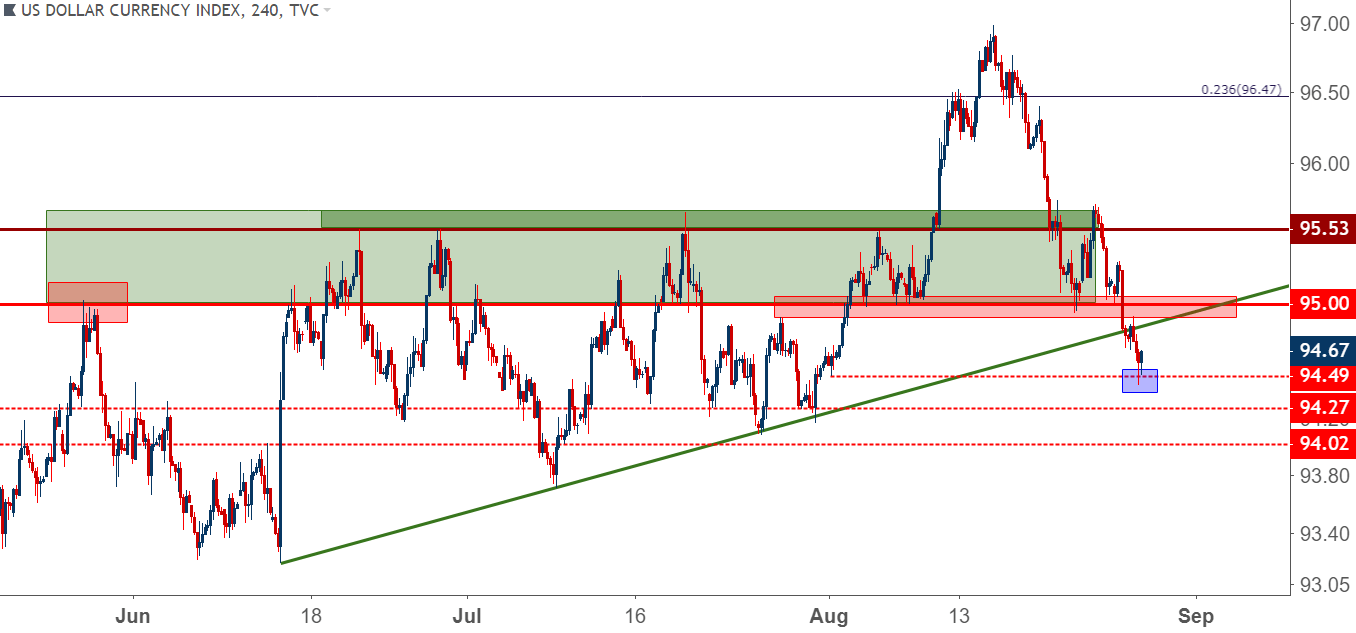
Chart prepared by James Stanley
As such, we looked at plays for USD weakness against USD/CHF and USD/CAD; and perhaps against EUR/USD should the bullish move there continue up past 1.1750. There remains attractive setups on the long side of the Dollar, as well, and we look at that in GBP/USD and AUD/USD.
The evening star formation on the weekly would be the primary driver of interest behind bearish USD themes, and that setup is below. The big question: Are sellers coming back to the US Dollar after a four-month hiatus?
US Dollar Weekly Price Chart: Evening Star at Fibonacci Resistance Completed Last Week

Chart prepared by James Stanley
EUR/USD To Fresh August Highs
In trading, it’s ok to be wrong, as that’s an unavoidable part of the endeavor. But – it’s not ok to be wrong for long, as that evaporation of additional equity simply to support one’s own ego is so costly that’s unlikely to be offset by even the best strategies or approaches. I’m referring to EUR/USD here, which has been in the midst of a rip-roaring rally for the past two weeks with very little slowdown or pullback. I’ve been attempting to find resistance on the pair for the past three weeks, and while I caught a day of downside-run last week, that theme was short-lived and bulls soon came back to continue pushing prices higher. With EUR/USD now perched up to fresh August highs, we’re testing the last of the resistance zones in this week’s FX Setups that I was looking for and that runs from 1.1709 up to 1.1750.
EUR/USD Daily Price Chart
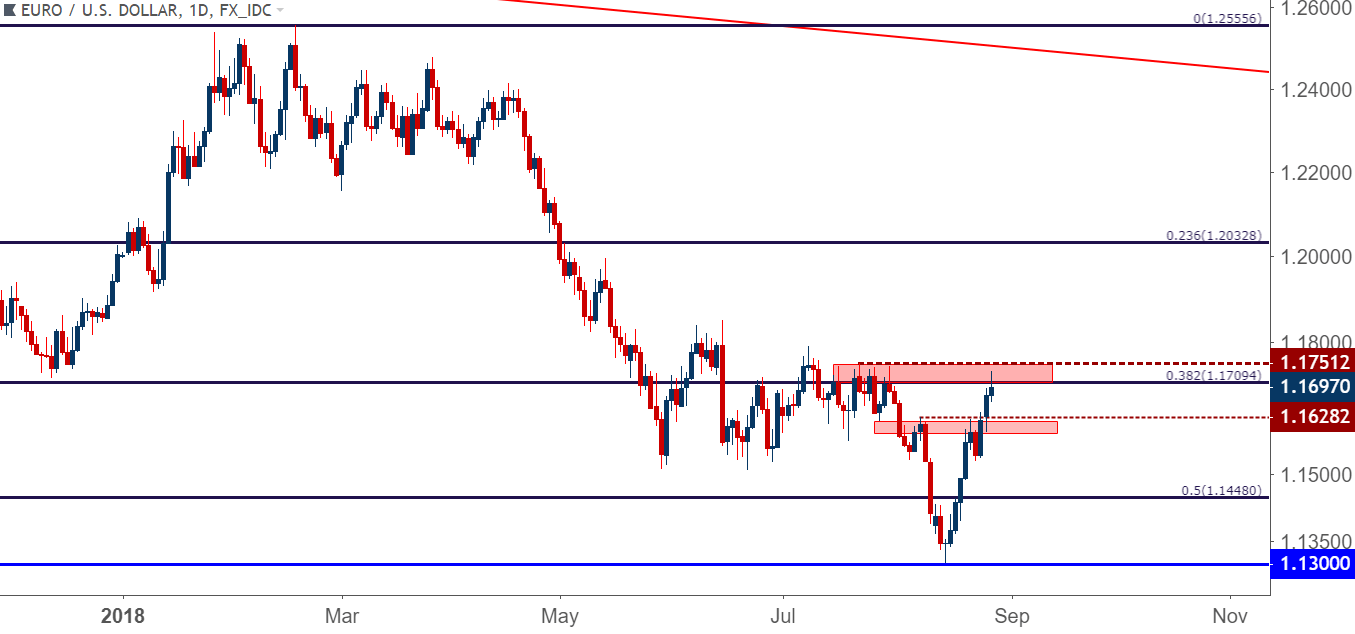
Chart prepared by James Stanley
If EUR/USD can close the month on a strong note, the monthly chart becomes of interest as we have a non-completed hammer formation showing over August price action. This type of formation will often come in around lows as sellers were offset by bullish price action took over intra-bar.
EUR/USD Monthly Price Chart: Non-Completed Hammer Formation, Bounce From 78.6% Fibonacci Support
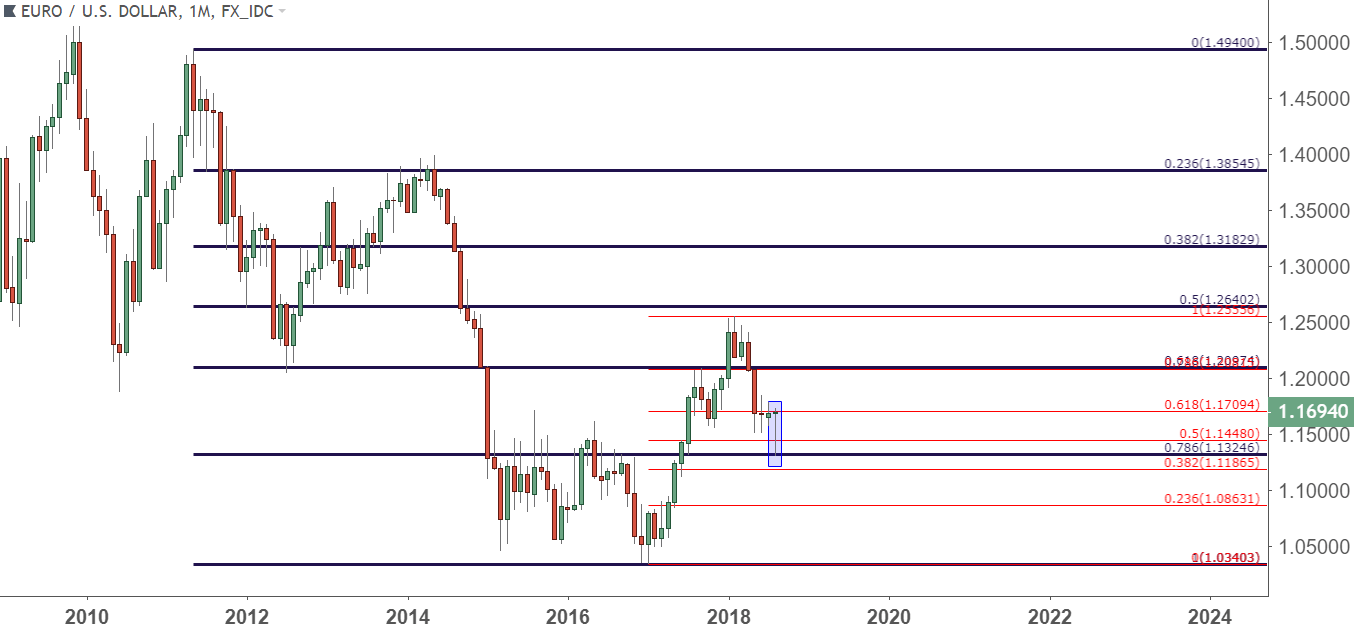
Chart prepared by James Stanley
GBP/USD Works Deeper into Digestion Wedge
We looked at counter-trend bullish setups in the pair last week, and prices soon moved up to our second target/resistance area, and prices then pushed-lower. Coming into this week, we looked for bearish strategies on the pair again, repurposing last week’s resistance for short-side continuation.
That resistance came into play earlier this morning, and after prices sold-off from that zone. We still haven’t yet seen bulls relent, as we had a short-term element of higher-low support that’s still holding the down-side, but since the webinar we’ve seen sellers continue to push.
GBP/USD Four-Hour Price Chart: Deeper into the Wedge, Sellers Respond to Resistance with Lower-High

Chart prepared by James Stanley
AUD/USD Testing Resistance After Confluent Support Bounce
Aussie is another area we were looking at for counter-trend setups last week; and this is also a market that contrasts nicely with the very bullish price action that’s shown in EUR/USD. While AUD/USD has a similar mid-August swing-low, the bullish follow-thru over the last week has been quite a bit more suspect than what we’ve seen in the Euro. While EUR/USD erased all of those August losses and then some, AUD/USD remains well below prior August highs. For those looking for USD-strength, this could remain an attractive area under the presumption of continuation of the 2018 down-trend in the pair.
AUD/USD Daily Price Chart: Mid-August Bounce From Support, Less Enthusiastic Follow-Thru

Chart prepared by James Stanley
USD/JPY Builds Support, But Bulls Yet Unable to Test Highs
We’ve been following USD/JPY through the month as the pair was previously showing some very messy price action. More recently, that’s begun to clear up and on USD/JPY, it appears as though we’ve had a decent build of support around the 111.00 level. However – bears haven’t yet relented and if we do get continued tests of this support, it’s unlikely to hold up for long. A topside test above the 111.50 figure could, at the very least, show that buyers are able to begin overpowering sellers, and that could soon reopen the door to strategies of strength (looking for higher-low support). Until then, remain skeptical.
USD/JPY Hourly Price Chart
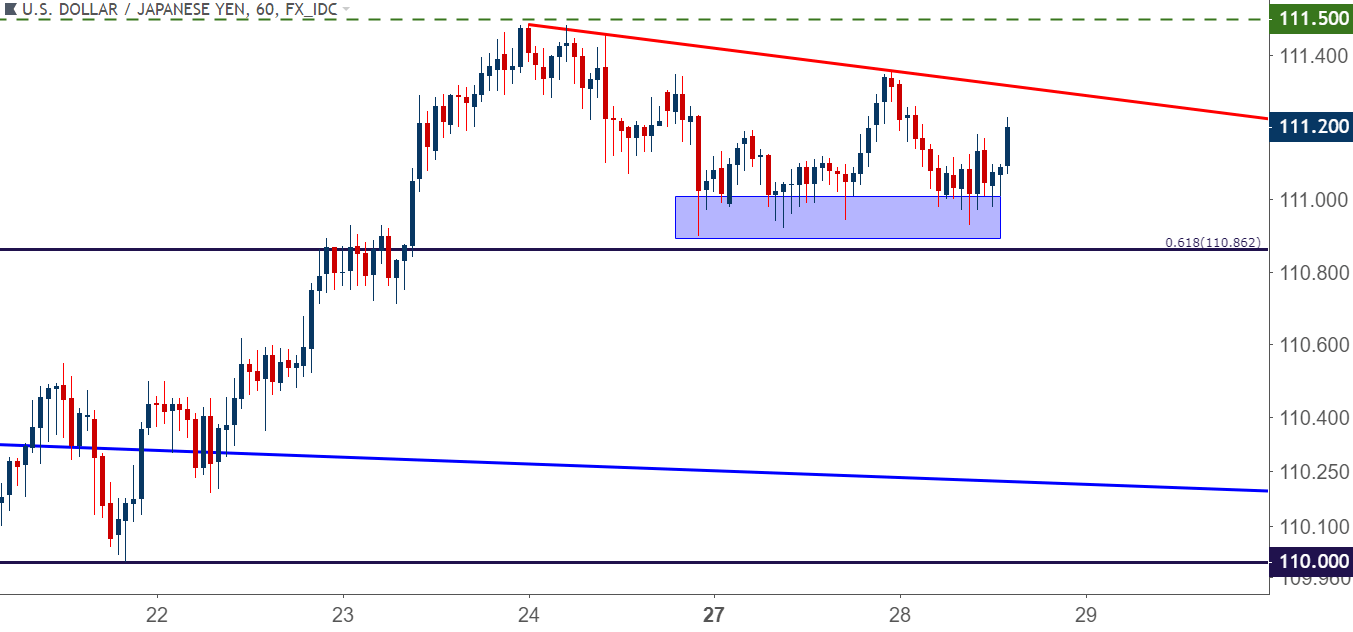
Chart prepared by James Stanley
USD/CAD Breakdown – Bearish Continuation Possibilities
For short-side USD strategies, the breakdown that’s shown in USD/CAD and USD/CHF to go along with that move will likely elicit the most interest. Given the continuation of those breaks through this week, those themes would appear open to continuation. In USD/CAD, we looked at the prospect of lower-high resistance around the 1.2950, taken from a batch of prior support following the initial 1.3000 break.
USD/CAD Hourly Price Chart: Lower-High Resistance Potential for Bearish Continuation

Chart prepared by James Stanley
USD/CHF Breaks Wedge and Continues to Run
We have a similar backdrop in USD/CHF, where prices broke-below a wedge and continued to run with only very little pullback. For traders looking at strategies of bearish USD continuation, recent price action can be used to look for lower-high resistance around prior areas of support, primarily looking to .9787 and again around .9809.
USD/CHF Hourly Price Chart

Chart prepared by James Stanley
To read more:
Are you looking for longer-term analysis on the U.S. Dollar? Our DailyFX Forecasts for Q1 have a section for each major currency, and we also offer a plethora of resources on USD-pairs such as EUR/USD, GBP/USD, USD/JPY, AUD/USD. Traders can also stay up with near-term positioning via our IG Client Sentiment Indicator.
Forex Trading Resources
DailyFX offers a plethora of tools, indicators and resources to help traders. For those looking for trading ideas, our IG Client Sentiment shows the positioning of retail traders with actual live trades and positions. Our trading guides bring our DailyFX Quarterly Forecasts and our Top Trading Opportunities; and our real-time news feed has intra-day interactions from the DailyFX team. And if you’re looking for real-time analysis, our DailyFX Webinars offer numerous sessions each week in which you can see how and why we’re looking at what we’re looking at.
If you’re looking for educational information, our New to FX guide is there to help new(er) traders while our Traits of Successful Traders research is built to help sharpen the skill set by focusing on risk and trade management.
--- Written by James Stanley, Strategist for DailyFX.com
Contact and follow James on Twitter: @JStanleyFX


