


Using Elliott Wave Theory our analysis for US Dollar Index, EURUSD, Gold, and AUDUSD hints continued weakness for the US dollar.
The video above is a recording of a US Opening Bell webinar from August 27, 2018. We focused on the Elliott Wave pattern for US Dollar Index, EURUSD, Gold, and AUDUSD. According to Elliott Wave Theory, US Dollar is weakening in a bear market.
US Dollar Index Elliott Wave Analysis
US Dollar Index has decisively rolled over from its August 15 peak as bearish patterns begin to build. We are counting this current Elliott Wave as circle wave ‘a’ of an a-b-c zigzag pattern. This suggests that a multi-month corrective dip has just begun and US dollar is getting ready to dip below 94.16.

There is some question as to whether the corrective rally terminated at the August 23 high (right side above) or if that was simply the ‘a’ wave of a larger a-b-c flat pattern (left side above).
Both charts above are bearish, the difference being the timing of when the bearish trend resumes. If DXY is in the expanded flat pattern, then a rally will likely draw it back to the 95.70 area. Otherwise, the resumption of the downtrend is already on its way to below 94.16 and possibly 91.50.
Both near term bearish views are valid so long as dollar index holds below 96.98.
EURUSD Elliott Wave Chart Points to Multi-Month rally
Last week, we stopped out of our short EURUSD trade from April booking profits as the Elliott Wave from February 2018 concludes. We are anticipating a multi-month rally that may eventually carry up to 1.20-1.22. We are awaiting a clearer pattern before emerging in to a long position EURUSD position.
Sentiment has certainly fed a movement higher in EURUSD as traders dropped from being 55% long to 41% long over the past week. This further indicates a bullish bias. However, there is a bit of congestion and resistance near 1.1750 so we will sit on the sidelines and await clarity before continuing to proceed.
Gold price chart rallies as US dollar tops
Inspecting the gold price chart, we see a rally that coincides with the top in US dollar. This rally in gold is moving higher as an impulse wave. Therefore, we are anticipating the bullish sequence of waves to continue to unfold towards higher levels. $1224 is an initial target level where wave relationships exist and former congestion from July. The potential exists for even higher levels beyond there.
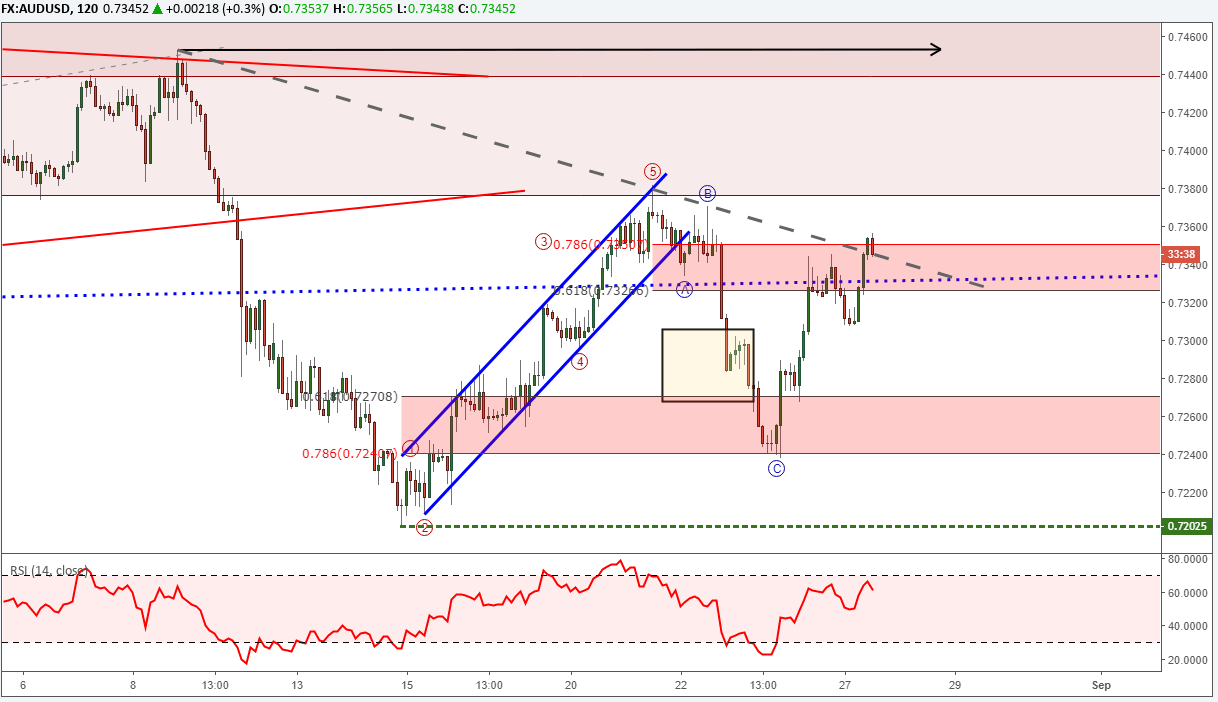
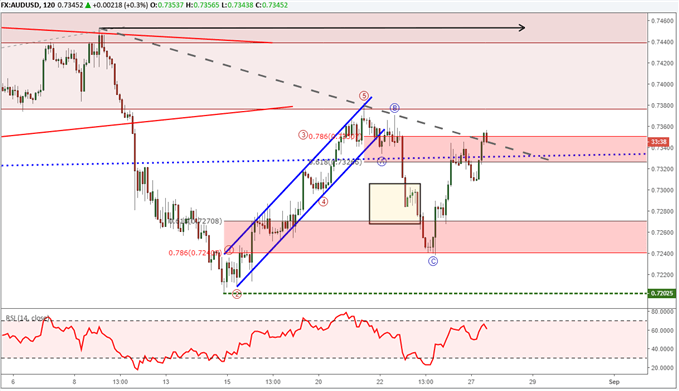
AUDUSD Elliott Wave chart illustrates the beginning of a bullish rally underway
On August 1, we forecasted a bullish reversal in AUDUSD from nearby levels that could begin “in the 72 cent handle.” Two weeks later, the AUDUSD chart bottomed at .7203 and has rallied over 100 pips since then. We believe this is a bullish corrective rally is similar to EURUSD. We are anticipating this bullish rally to be wave ‘2’ or wave ‘b’ and are expecting it to be a partial retracement higher.
There is a bit of resistance AUDUSD is trying to process through near .7350. A successful push above here diminishes the near term bearish patterns and opens the door for AUDUSD to 76-78 cents.
Elliott Wave Theory FAQ
When do I start counting Elliott Wave?
This is a common question of newer traders to Elliott Wave Theory. There are a couple of patterns I look for when starting my analysis. The Elliott Wave triangle pattern is one of those starting points because triangle form at certain spots within the Elliott Wave count. Therefore, if a triangle has been properly identified, we can then narrow the possibilities of the Elliott Wave count to begin to formulate higher probability patterns.
Learn more with “Forex Education : How do you begin counting Elliott Waves? “
After reviewing the guides above, be sure to follow future Elliott Wave articles to see Elliott Wave Theory in action.
If you are seeking further study into Elliott Wave Theory, read about our expert tips in our beginners and advanced trading guides.
---Written by Jeremy Wagner, CEWA-M
Jeremy Wagner is a Certified Elliott Wave Analyst with a Master’s designation. Jeremy provides Elliott Wave analysis on key markets as well as Elliott Wave educational resources. Read more of Jeremy’s Elliott Wave reports via his bio page.
Communicate with Jeremy and have your shout below by posting in the comments area. Feel free to include your Elliott Wave count as well.
Discuss these markets with Jeremy in Monday’s US Opening Bell webinar.
Follow me on Twitter at @JWagnerFXTrader .


