


Last week, the selling in precious metals became climatic, and now the question is whether the bounce is only a short-term situation or the beginning of a broader rally. Crude oil is stuck between two key thresholds, how it treats them in the days ahead will be key to our outlook. The Dow is posting an uncommon chart pattern (‘RST’), will it have bullish or bearish implications? The DAX broke the February 2016 trend-line, but has yet to follow through.
Technical Highlights:
- Gold price has room to rally after selling climax reached
- Crude oil stuck between two major thresholds
- Dow sporting an ‘RST’ pattern (Reverse Symmetrical Triangle)
- DAX broke important Feb ’16 trend-line, but failing to follow through
See how the majority of traders are positioned in various markets/currencies and what it says about future price fluctuations – IG Client Sentiment
Gold price has room to rally after selling climax reached
Last week, gold experienced a climax in selling, posting a reversal day on Friday which blew life into the notion we had seen a bottom form. For now, it may only turn out to be short-term in nature, with room to take back the last leg of weakness which started up around the 1210 level.
As far as longer-term is concerned, we have seen recent signs of sentiment point to a more significant low in the works. Last week, we were looking at a futures sentiment indicator (DSI) which showed a single-digit percentage of bullishness for the metal, an unusual extreme.
Yesterday, we noted that positioning in the futures market turned net-short gold for the first time since August 2002. This backs up the extreme sentiment readings discussed last week. If last week wasn’t a major low, it looks like it won’t be long before one is found.
Gold Price Daily Chart (Has room to go on the upside)

For more in-depth fundamental and technical analysis, check out the Q3 Forecast for Gold
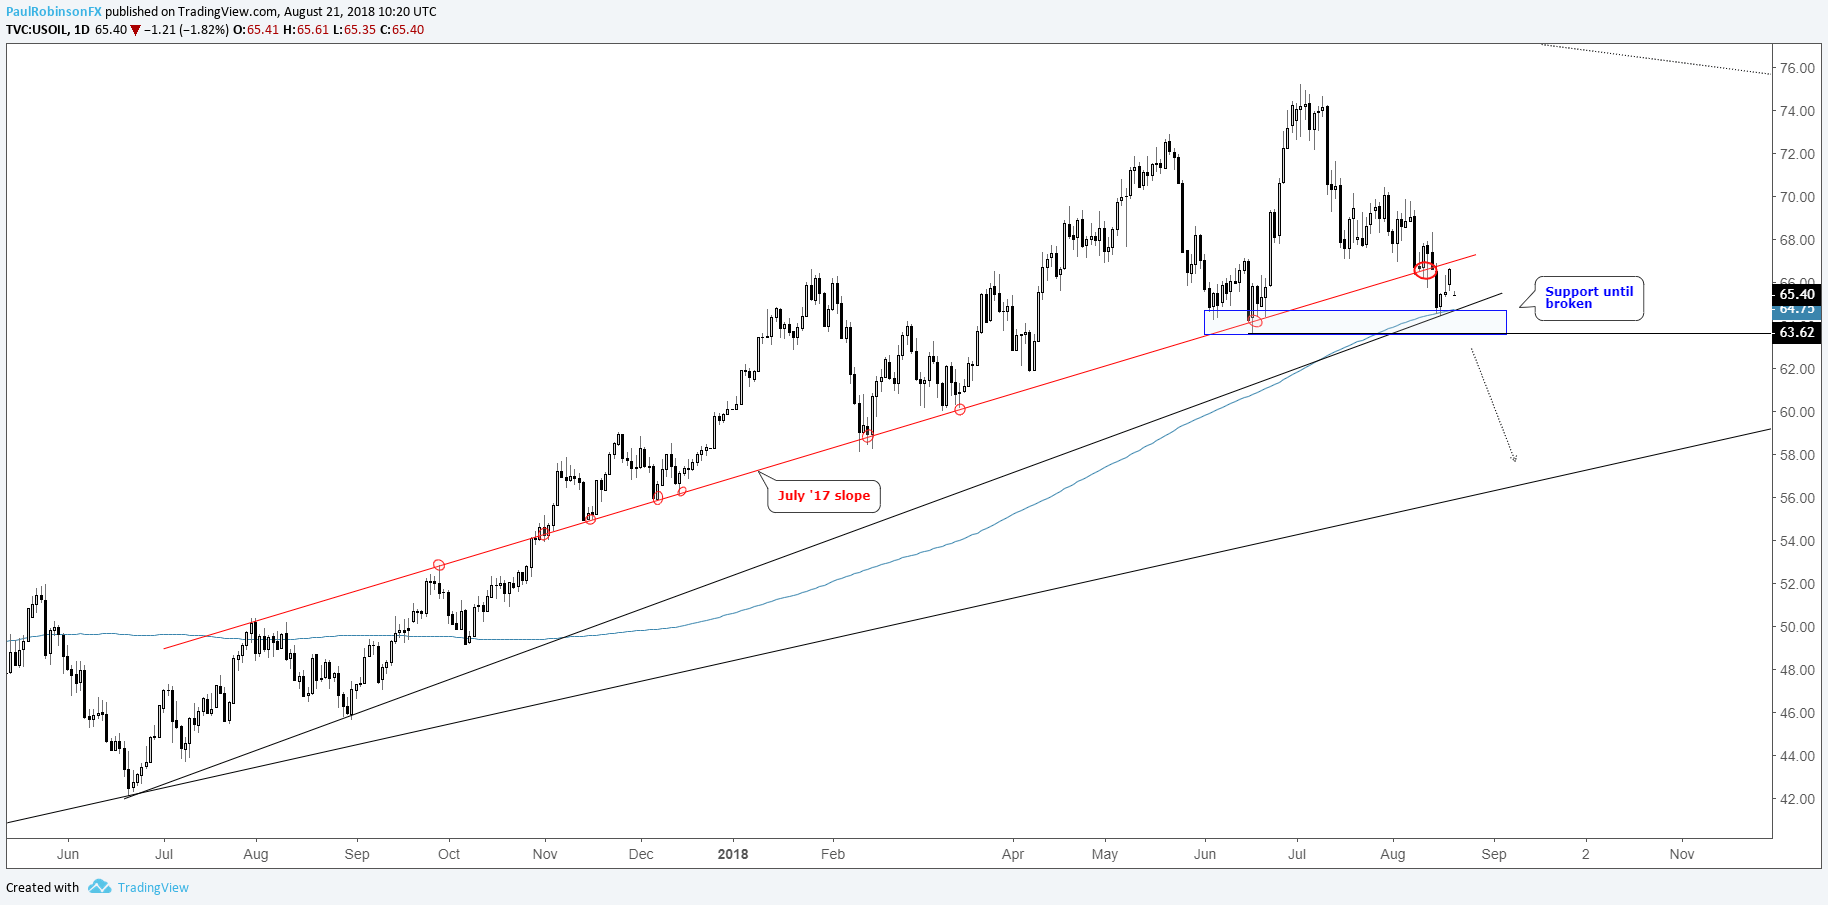
Crude oil stuck between two major thresholds
The July ‘17 slope in crude was snapped last week, bringing into play a trio of support by way of the June ’17 trend-line, 200-day, and area surrounding the June low. The break of the 13-month slope was viewed as rather important and a slide below the next level of support is seen as a catalyst for a much broader decline to unfold.
.
WTI Crude Oil Daily Chart (Stuck between the lines)
For more in-depth fundamental and technical analysis, check out the Q3 Forecast for Crude Oil
Dow sporting an ‘RST’ pattern (Reverse Symmetrical Triangle)
Since the 26th of last month, the Dow has been carving out a reverse symmetrical triangle, or ‘RST’ for short. The pattern is a result of the market becoming increasingly unstable with price swings growing in both directions.
It could have bullish or bearish implications, although typically thought of as being a reversal formation. Determining its bias comes down to the next couple of price swings. A pullback from here which is well supported and eventually breaks to a new high will be an indication the rally wants to extend. A decline which fails to bring buyers will likely pick up downside momentum as the market heads towards the lower end of the pattern.
Dow Daily Chart (‘RST’ pattern)

For more in-depth fundamental and technical analysis, check out the Q3 Forecast for Global Equity Indices
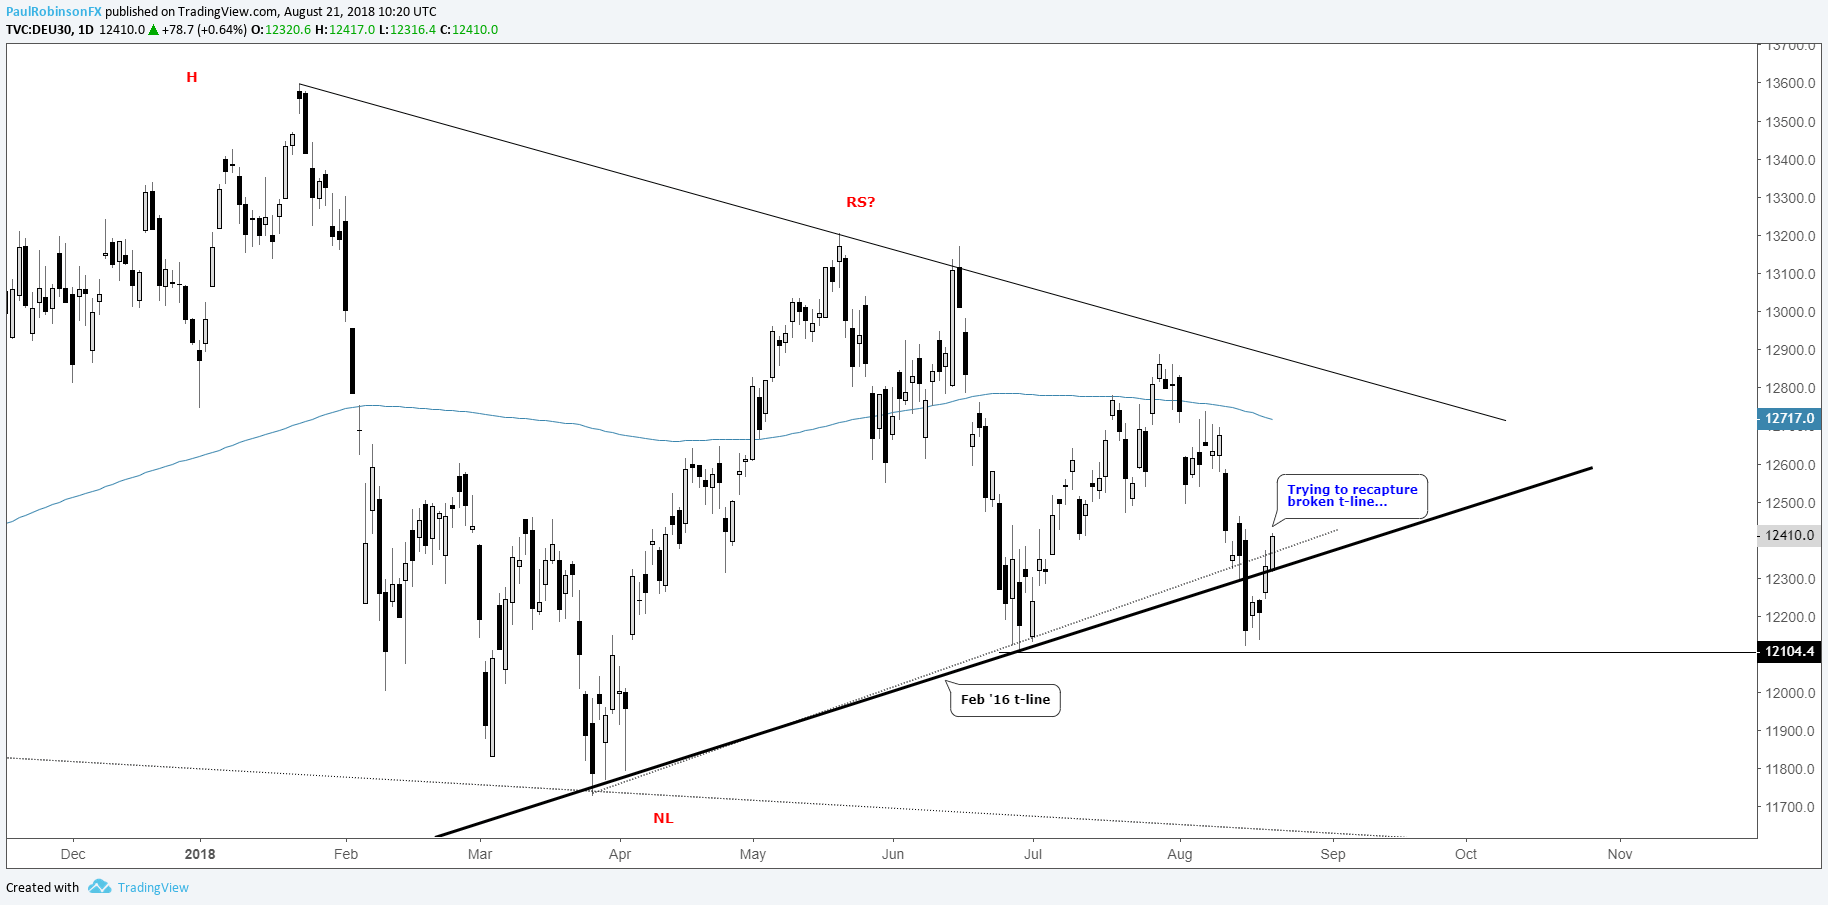
DAX broke important Feb ’16 trend-line, but failing to follow through
Last week, the DAX broke the February 2016 trend-line, but so far it has not mattered. Price is in retest mode now and will need to turn down soon to validate the break. For added confirmation, look for a breakdown beneath 12104 (June low) to turn outright bearish. A recapture of the trend-line would indicate a false breakdown and further strength may lie ahead.
DAX Daily Chart (trading around Feb ’16 trend-line)
Resources for Index & Commodity Traders
Whether you are a new or an experienced trader, DailyFX has several resources available to help you; indicator for tracking trader sentiment, quarterly trading forecasts, analytical and educational webinars held daily, trading guides to help you improve trading performance, and one specifically for those who are new to forex.
---Written by Paul Robinson, Market Analyst
You can follow Paul on Twitter at @PaulRobinsonFX


