


This week brings a more calm economic docket, but a number of active themes remain across global markets. The US Dollar continued its topside run to put in yet another failed test at 95.53, and this brought a pullback to 95.00 on DXY that was promptly bought earlier this morning. But is the US Dollar out of the woods yet? And what might finally help to bring on those fresh yearly highs? Inflation sits on the calendar for this Friday – and that can be a very operative driver for Dollar bulls to work off of. Meanwhile, EUR/USD remains above the 1.1509 low from Q2, and USD/JPY is testing a key area of higher-low support.
Talking Points:
- If you’re looking to improve your trading approach, our Traits of Successful Traders research could help. This is based on research derived from actual results from real traders, and this is available to any trader completely free-of-charge.
- If you’re looking for a primer on the FX market, we can help. To get a ground-up explanation behind the Forex market, please click here to access our New to FX Trading Guide.
If you’d like to sign up for our webinars, we host an event on Tuesday and Thursday, each of which can be accessed from the below links:
Tuesday: Tuesday, 1PM ET
Thursday: Thursday 1PM ET
US Dollar Round Trip From Resistance to Support
The first market we looked at was DXY. The US Dollar opened the week by continuing to show strength as we saw on Thursday and Friday of last week. Prices ran all the way up to the 95.53 before pulling up a bit short, and this gives us yet another failed attempt from the Greenback to breakout to fresh yearly highs.
When we looked at USD this morning, the currency was finding a bit of support off of the psychological level of 95.00, and that topside move extended into our webinar. As we looked at the setup on the Daily and Four-Hour charts, the prospect of bullish continuation appears sound. The complication would come from the hourly chart, which is fairly far away from nearby support. This can keep the door open for a deeper retracement to as deep as 94.84.
US Dollar via ‘DXY’ Four-Hour Price Chart: 95.53 Resistance, 95.00 Support
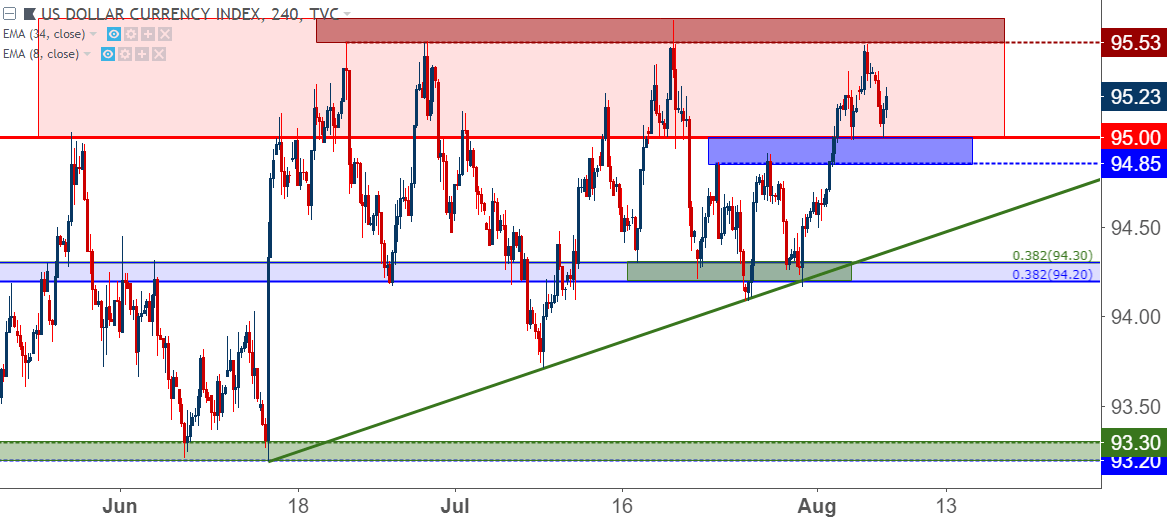
Chart prepared by James Stanley
EUR/USD Pulls Up Shy of Support: Deeper Retracement in Store?
EUR/USD again shied away from the 1.1500 level after extending its downside run following this week’s open. The pair twice put in failed attempts at 1.1500 in Q2; first in late-May as European politics was roiling Euro markets and again in June after the ECB rate decision. After that ECB meeting, we’ve spent most of the time building into a symmetrical wedge. The support side of that wedge started to give way last Thursday around the Bank of England; but the looming support underneath the formation appears to have stifled bear’s aggressiveness.
This can keep the door open for under-side breakouts around 1.1500, but traders looking to take on exposure ahead of a 1.1500 re-test may have to wait out a deeper topside move. We looked at another zone of potential resistance interest around 1.1650-1.1670.
EUR/USD Four-Hour Price Chart: Deeper Retracement Potential
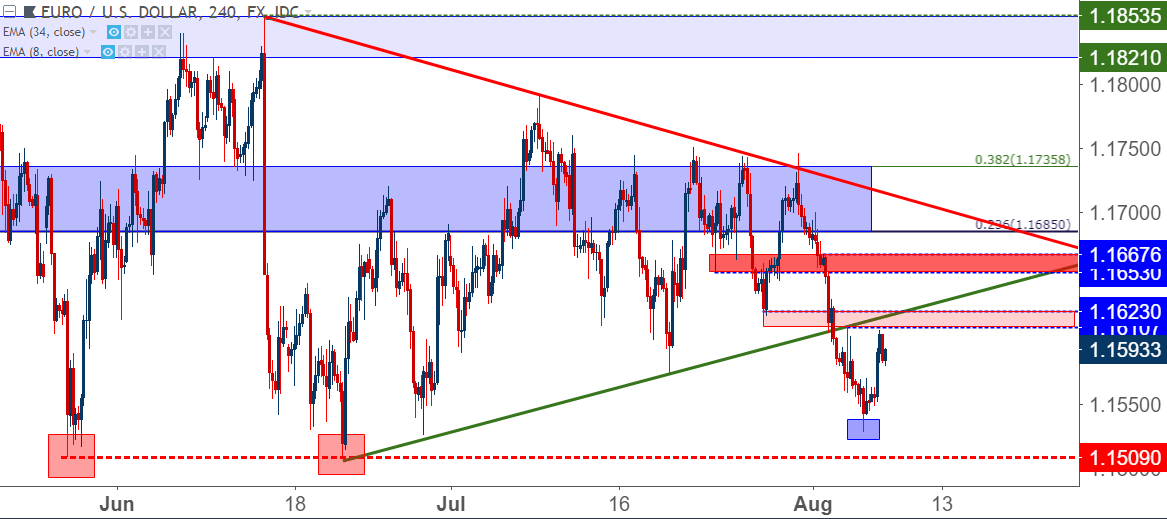
Chart prepared by James Stanley
GBP/USD Dropping Below 1.3000 Brings Challenges to Bearish Continuation
Cable has continued its downside run after last week’s BoE rate hike, which appears to have been a clinic in how a Central Bank can perform a ‘dovish rate hike.’ While the BoE did hike rates for only the second time in the past ten years, they were so incredibly pessimistic whilst doing so that buyers were unable to stage any lasting element of strength – and it’s basically been a straight run lower ever since. This makes the prospect of bearish continuation rather unattractive as we’re so far away from any near-by resistance points. If we do catch any element of a bounce, the door remains open for bearish strategies. Traders would likely want to wait until at least 1.3000 comes into play, and a bit-above that level is potential resistance around 1.3050 and 1.3081. The latter two levels can open the door for stops above the 1.3117 Fibonacci level.
GBP/USD Four-Hour Price Chart: Bearish But Beleaguered Below 1.3000
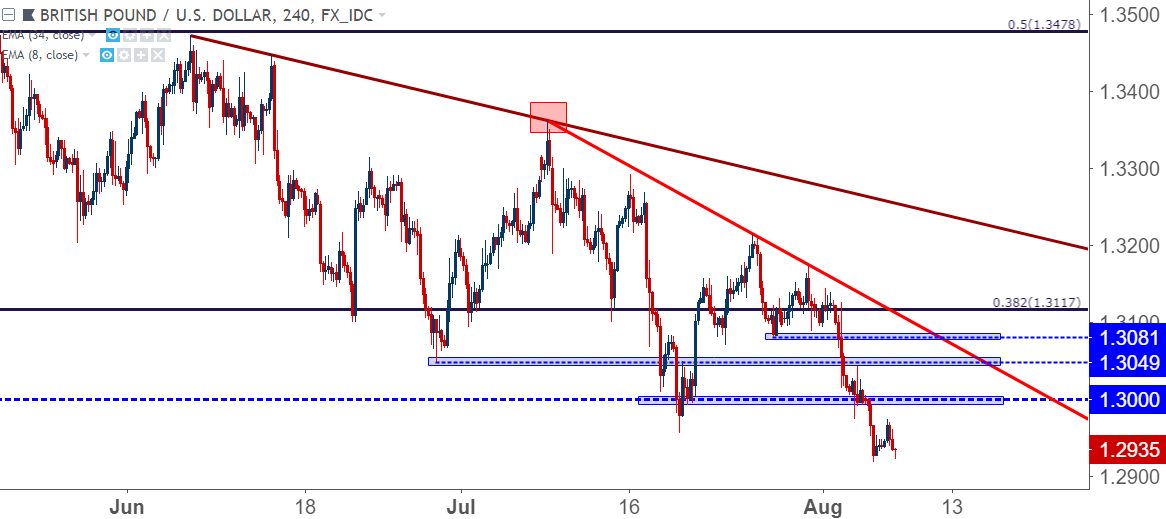
Chart prepared by James Stanley
USD/CAD Slow Hold of 1.3000
We started off with the Daily chart to illustrate how the longer-term setup appears to be showing buyer defense of the 1.3000 psychological level. But price action on lower time frames highlights the lower-lows and lower-highs that had been showing. That started to come into question as we were looking at the pair, and I showed the criteria that I wanted to see before establishing bullish exposure. With prices now testing the 1.3065 Fibonacci level, traders can look for a pullback and higher-low around the 1.3049 area on the chart, which can keep the door open for bullish continuation strategies.
USD/CAD Hourly Price Chart
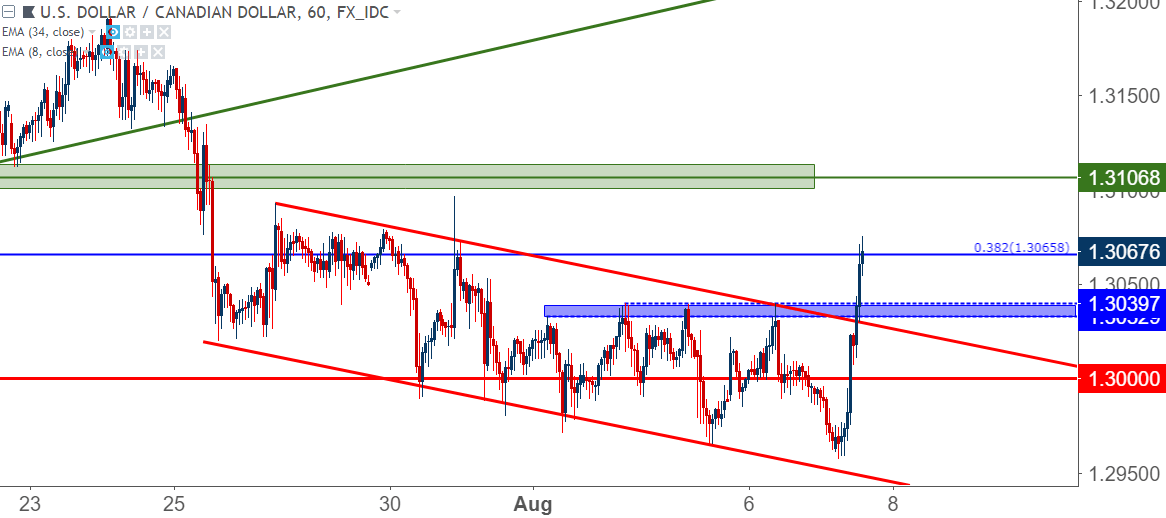
Chart prepared by James Stanley
USD/JPY Digesting Prior Bullish Breakout
We looked into USD/JPY this morning, and we took an updated look at the pair in the webinar. The longer-term setup here is fairly clear: Prices are attempting to cauterize support around an area of prior resistance after the earlier-July breakout. Last week saw another bullish breakout in the pair, but that one quickly fell back as prices reverted back to the mean. At this stage, we have a hold of that support around a key area on the chart, keeping the door open for bullish continuation.
For entry, we went down to an hourly chart to show how waiting for topside momentum or bullish indications could be used to get in the direction of that longer-term trend or theme.
USD/JPY Daily Price Chart: Bulls Attempting to Hold Support at Prior Resistance
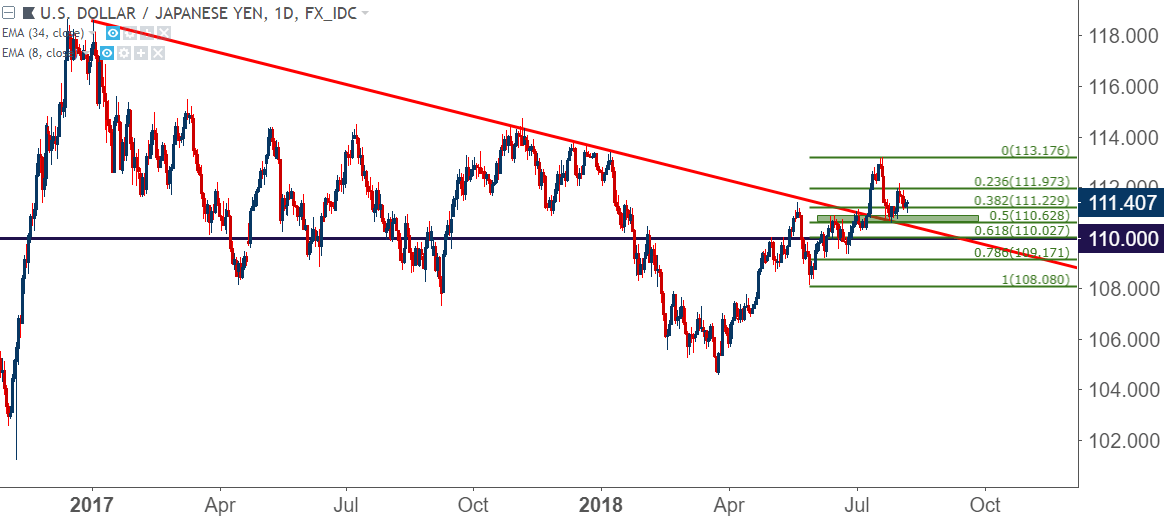
Chart prepared by James Stanley
EUR/JPY With Reversal Potential as Morning Star Attempts to Build
A big support level came into play in EUR/JPY yesterday at 128.52. This is the 38.2% Fibonacci retracement of the 2012-2014 major move in the pair, and it’s come into play multiple times over the past year as both support and resistance.
We then looked at a potential morning star formation that’s attempting to build on the Daily Chart. The confirmed completion of this formation opens the door for bullish reversals in the pair using that 128.52 level as support for stop placement.
EUR/JPY Daily Price Chart: Bulls Attempt to Hold Fibonacci Support
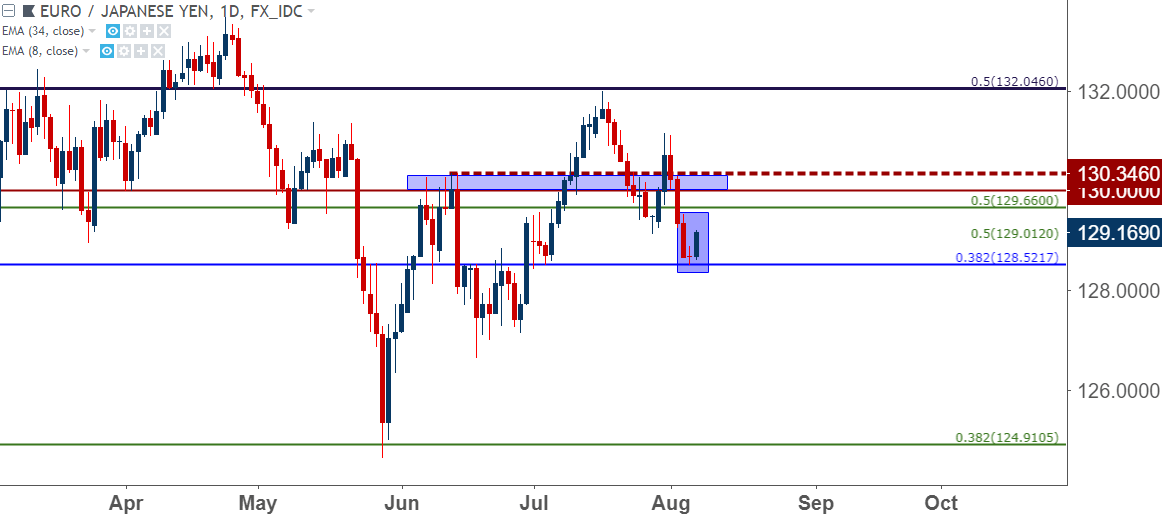
Chart prepared by James Stanley
GBP/JPY Dynamics
We drew up a GBP/JPY chart using a series of longer-term Fibonacci levels in the effort of devising short-term strategy. Of interest to the current setup in the pair is a shorter-term support level at 143.79, which is the 38.2% retracement of the October, 2016 to February, 2018 major move. This same level helped to set lows in late-May and again in June, and I showed how I can use a moving average (or two) on shorter-term charts to trade bullish setups off of that support level.
GBP/JPY Hourly Price Chart: Using Short-Term Charts to Trade Long-Term Support
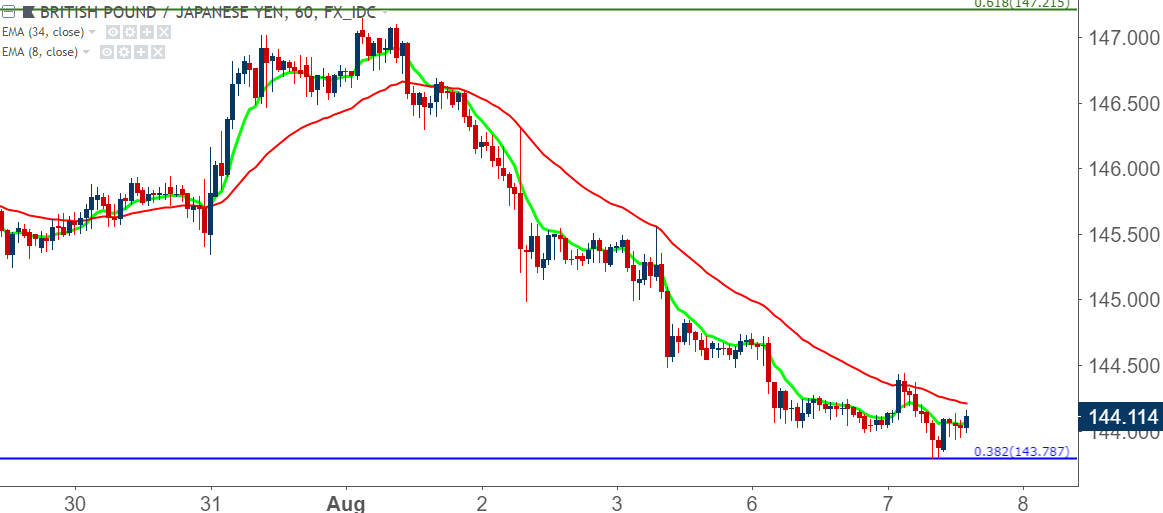
Chart prepared by James Stanley
Dow Jones Breaks Out to Fresh Highs
We closed by looking at US stocks, which continue to gain after last week’s FOMC-Fueled pullback. The Dow Jones Industrial Average has shown less momentum than what’s availed itself in the Nasdaq 100 or the S&P 500; but this can keep the door open for topside trend strategies. We looked at an additional area for potential higher-low support around the 25,370 area, which is the 14.4% Fibonacci retracement of the post-Election move in the index.
Dow Jones Four-Hour Price Chart: Bullish Continuation Potential
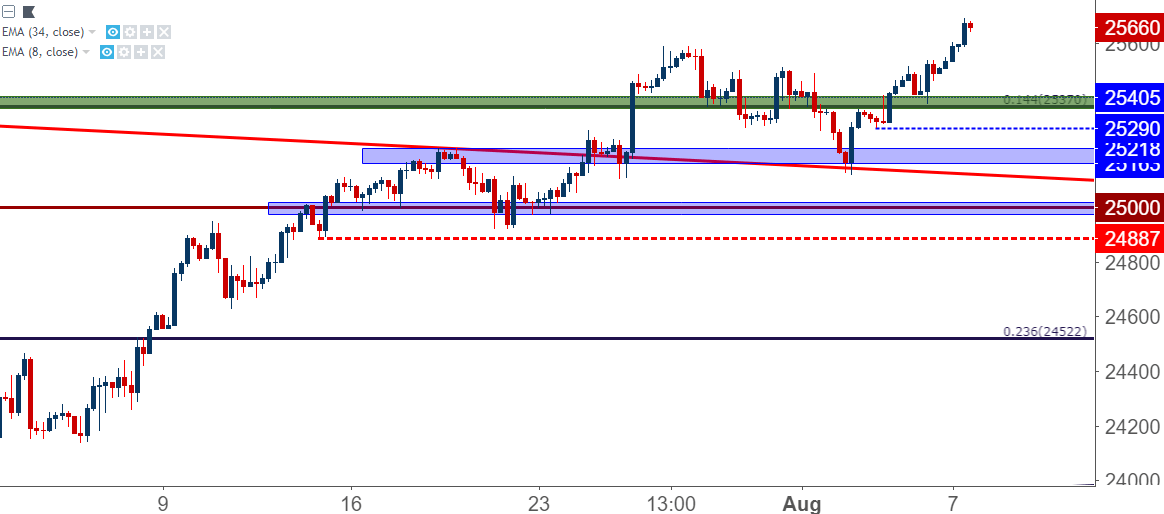
Chart prepared by James Stanley
To read more:
Are you looking for longer-term analysis on the U.S. Dollar? Our DailyFX Forecasts for Q1 have a section for each major currency, and we also offer a plethora of resources on USD-pairs such as EUR/USD, GBP/USD, USD/JPY, AUD/USD. Traders can also stay up with near-term positioning via our IG Client Sentiment Indicator.
Forex Trading Resources
DailyFX offers a plethora of tools, indicators and resources to help traders. For those looking for trading ideas, our IG Client Sentiment shows the positioning of retail traders with actual live trades and positions. Our trading guides bring our DailyFX Quarterly Forecasts and our Top Trading Opportunities; and our real-time news feed has intra-day interactions from the DailyFX team. And if you’re looking for real-time analysis, our DailyFX Webinars offer numerous sessions each week in which you can see how and why we’re looking at what we’re looking at.
If you’re looking for educational information, our New to FX guide is there to help new(er) traders while our Traits of Successful Traders research is built to help sharpen the skill set by focusing on risk and trade management.
--- Written by James Stanley, Strategist for DailyFX.com
Contact and follow James on Twitter: @JStanleyFX


