


Precious metals (gold & silver) continue to have generally weak price action, however; a break of the trend-line in gold may provide a lift. Silver is in the process of forming a descending wedge. WTI crude oil continues to try and hold above the important July ‘17 slope, is this is a positive sign? While U.S. indices continue to traverse record territory (for the most part, Dow aside), the DAX still has bearish potential.
Technical Highlights:
- Gold & silver charts remain weak, the latter has a chart pattern to watch
- WTI crude oil continues to hold above ’17 slope; a good thing?
- The DAX has bearish potential, but need to see support break first
Recently we released new quarterly forecasts; to see our fundamental and technical insights on major markets and currencies, check out the DailyFX Q3 Forecasts.
Gold & silver charts remain weak, the latter has a chart pattern to watch
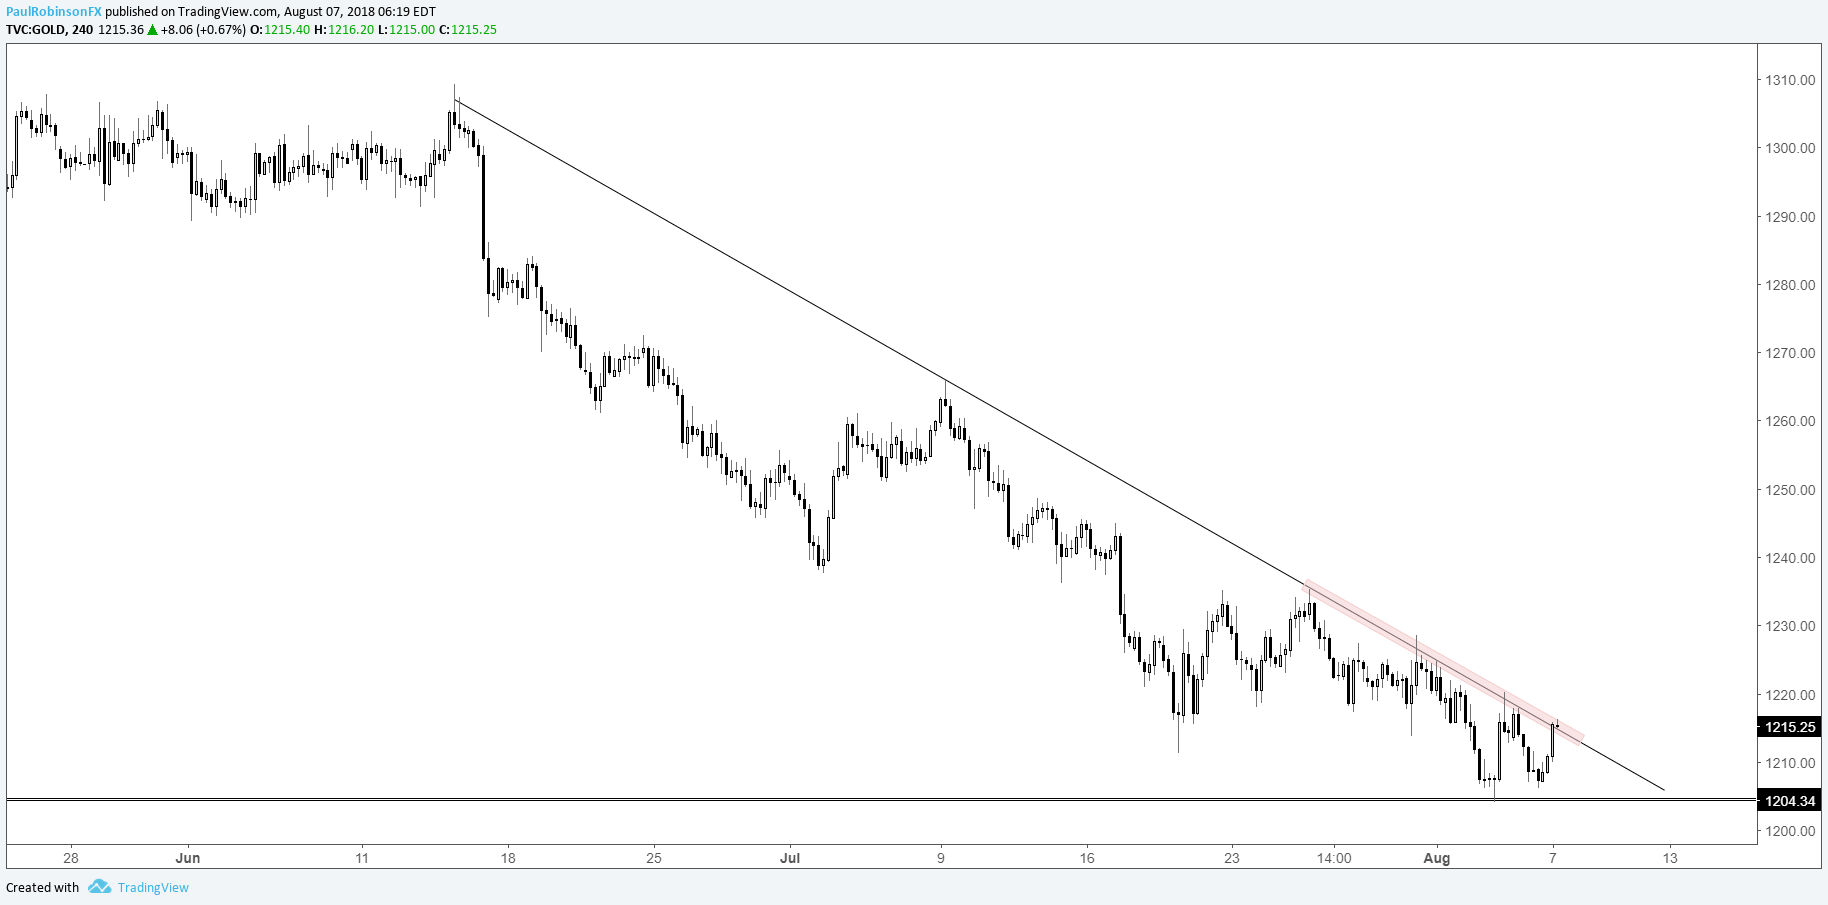
Gold has continued lower in-line with our expectations, with price testing noted support in the 1205/1195 region. Price action remains weak as sellers step in on every little bounce, however; tactically speaking, at this time there isn’t a real good spot from a risk/reward perspective to jump in on fresh swing shorts. If the trend-line from June breaks gold may start to find a bid, a scenario in which we would first look for a strong push higher then a pullback with a higher-low forming.
Gold 4-hr Chart (Trend-line in focus)
For more in-depth fundamental and technical analysis, check out the Q3 Forecast for Gold
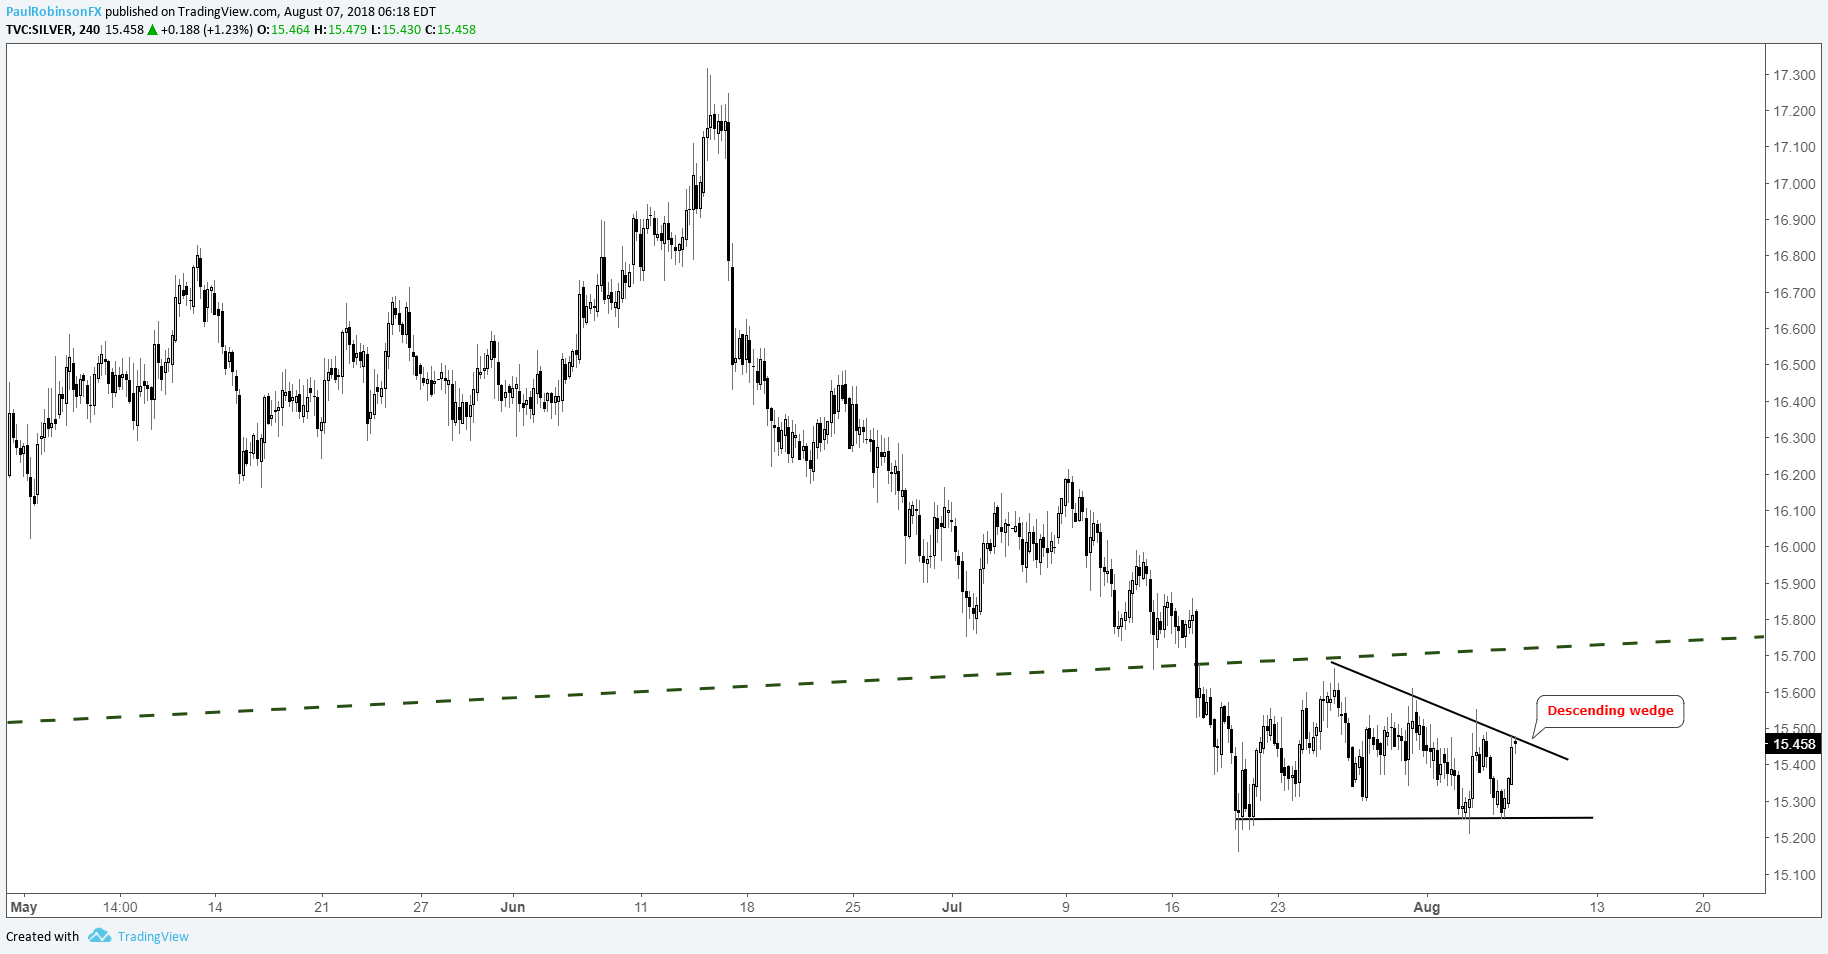
Silver, on the other hand, the one we have been mostly staying away from, could offer up a nice technical pattern for another drive lower. A descending wedge is building on the 4-hr time-frame and with a turn down and break of the underside of the pattern another round of selling may commence. It could break to the top-side, but given the descending nature of the pattern and trend it is preferred we see a bearish break.
Silver 4-hr Chart (Descending wedge forming)
WTI crude oil continues to hold above ’17 slope; a good thing?
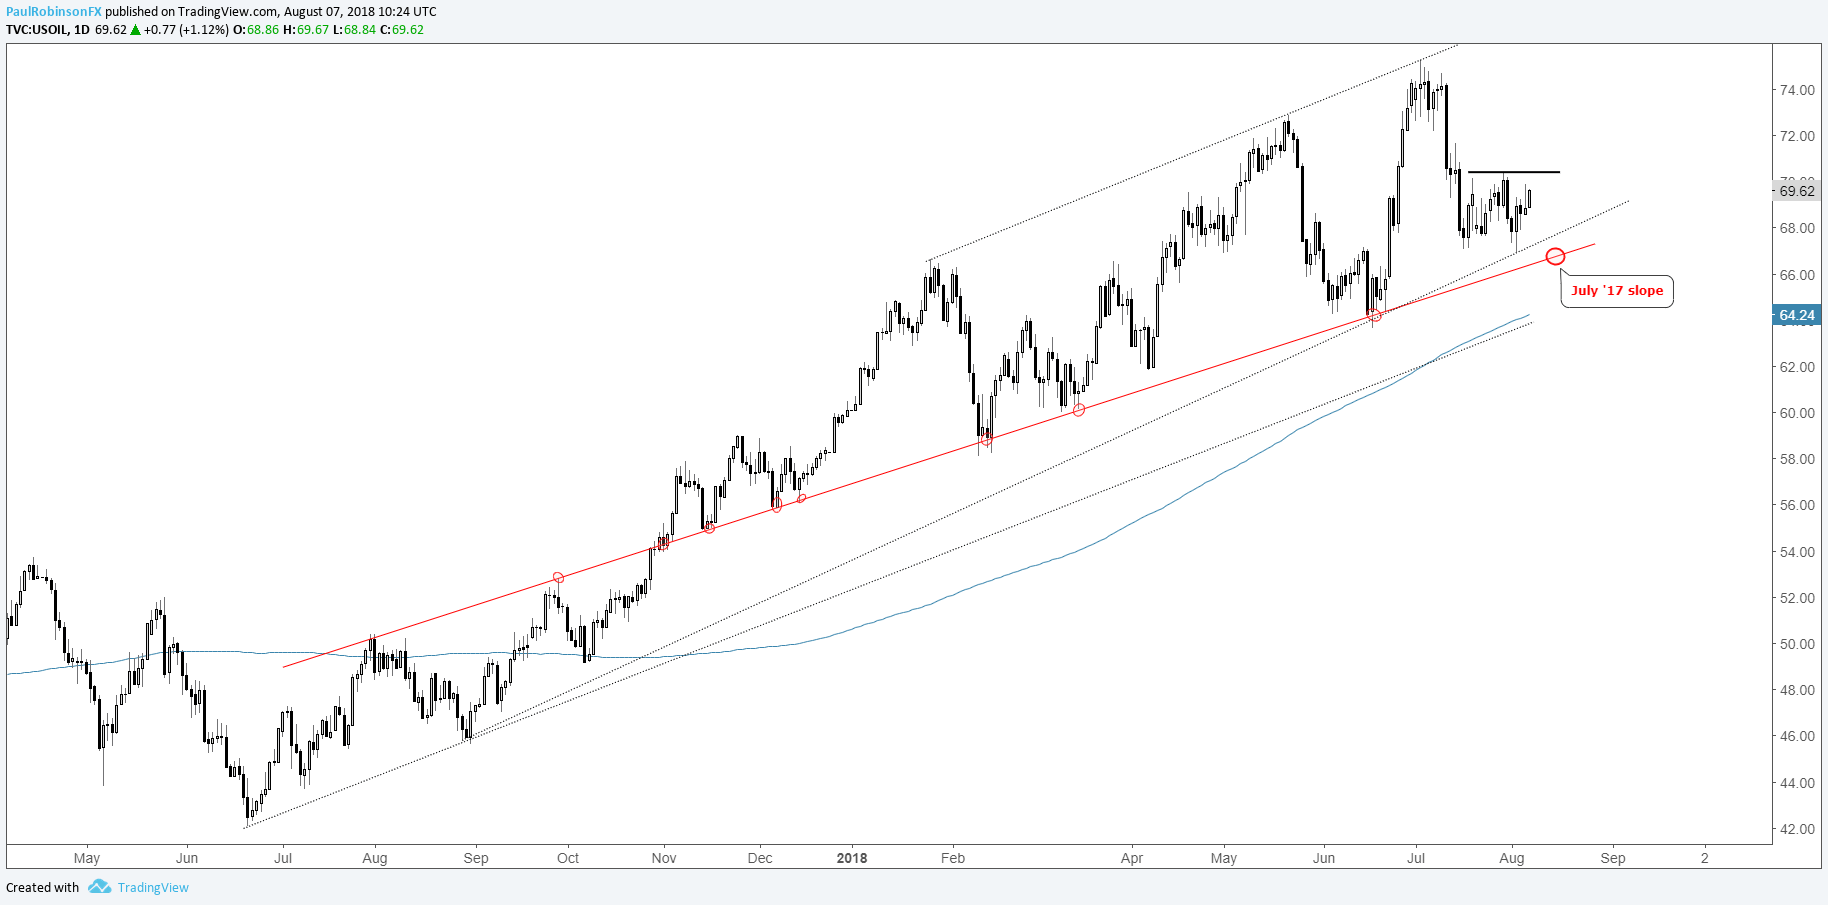
Over the months, given the number of turning points, we’ve put a lot of focus on the slope from July of last year, and recently it came back front and center. But instead of testing it as anticipated, crude has so far managed to find a floor ahead of it.
This may be a bullish event as buyers step in ahead of a very influential line of support. It was an event which occurred at the end of June in the S&P 500, as it sidestepped a test of the Feb ’16 trend-line/200-day combo by about 0.5% or so before trading strongly higher.
It’s preferable to see a solid line of support tested before taking any action, but as long as it stays above then the outlook remains neutral to bullish. Near-term price action is choppy and isn’t offering any great indications. A break above 70.40 may get oil rolling again…
WTI Crude Oil Daily Chart (Holding above July ’17 slope)
For more in-depth fundamental and technical analysis, check out the Q3 Forecast for Crude Oil
The DAX has bearish potential, but need to see support break first
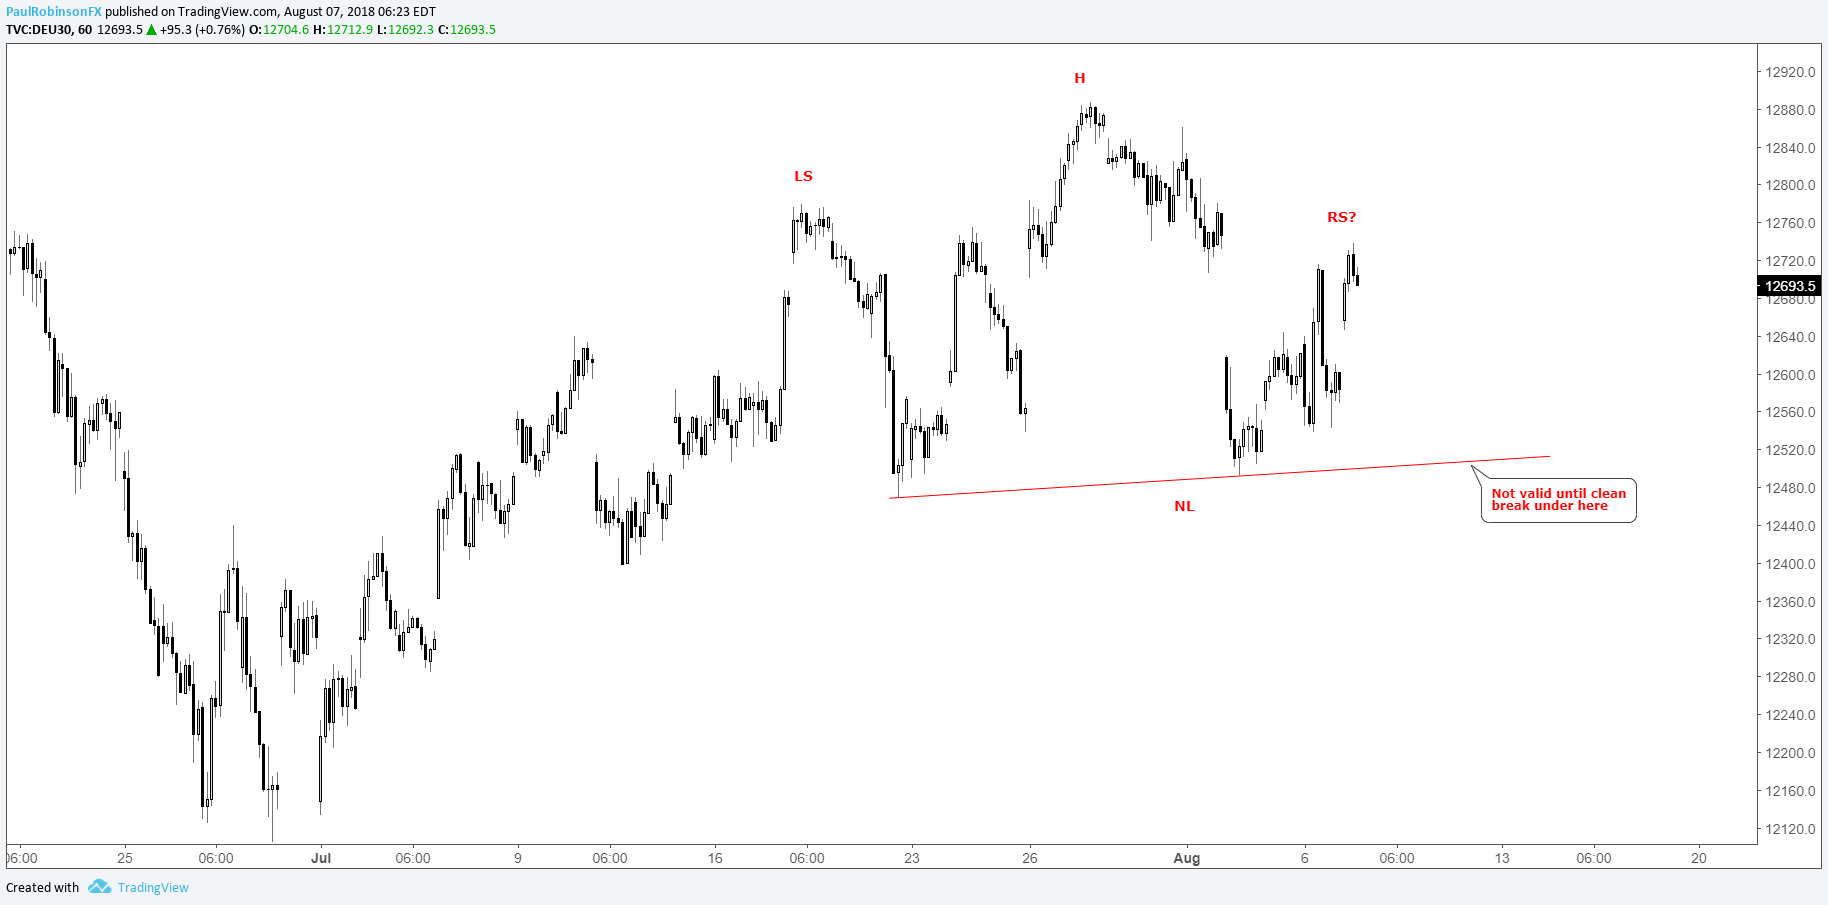
As discussed a little earlier this morning the DAX has potential to trading lower if the short-term H&S formation is triggered on a solid neckline break. But if the neckline isn’t broken then bearish bets will stay on the back-burner.
For more in-depth fundamental and technical analysis, check out the Q3 Forecast for Global Equity Indices
DAX 1-hr Chart (Head-and-shoulders potential)
Resources for Index & Commodity Traders
Whether you are a new or an experienced trader, DailyFX has several resources available to help you; indicator for tracking trader sentiment, quarterly trading forecasts, analytical and educational webinars held daily, trading guides to help you improve trading performance, and one specifically for those who are new to forex.
---Written by Paul Robinson, Market Analyst
You can follow Paul on Twitter at @PaulRobinsonFX


