


The heavy week of FX data nears its end as tomorrow brings Non-Farm Payrolls out of the United States for the month of July. Yesterday’s FOMC rate decision brought little by way of new information to markets, but it did end up driving a wave of US Dollar strength as the currency is now testing-above the 95.00 level on DXY for the first time in two weeks. This morning’s BoE rate decision did bring a rate hike for only the second time in the past decade, but the bank was so dovish and frankly, unclear in the remaining part of the statement and press conference that it’s becoming increasingly difficult to muster anything but a bearish view of the British Pound. In this webinar, we looked at setups around the US Dollar ahead of tomorrow’s Non-Farm Payrolls Release.
Talking Points:
- If you’re looking to improve your trading approach, our Traits of Successful Traders research could help. This is based on research derived from actual results from real traders, and this is available to any trader completely free-of-charge.
- If you’re looking for a primer on the FX market, we can help. To get a ground-up explanation behind the Forex market, please click here to access our New to FX Trading Guide.
If you’d like to sign up for our webinars, we host an event on Tuesday and Thursday, each of which can be accessed from the below links:
Tuesday: Tuesday, 1PM ET
Thursday: Thursday 1PM ET
US Dollar Testing 95.00 Resistance After FOMC
The FOMC mentioned the word ‘strong’ multiple times in yesterday’s statement from the August rate decision. Despite the fact that the bank made no material changes to monetary policy, the focus on continued strength in the US economy denotes the potential for the bank to remain in a hawkish stance as we trade into 2019. Coming into the meeting, markets were looking for another two rate hikes in 2018, and odds for a 25 basis point move in both September and December strengthened through yesterday’s announcement. But now we have the potential for markets to catch up to the Fed’s forecast of looking for another three rate hikes in 2019. If inflation remains strong, and if jobs numbers continue to print with strength, we could see that theme of higher US rates and a strong US Dollar continue to play out.
At this stage, we must remain suspect of the move as DXY price action is testing an area that’s had a tendency to turnaround bullish advances over the past two months. Tomorrow’s Non-Farm Payrolls data could give bulls the motivation that they need to finally drive thru, but most likely we’re going to be looking for clues around inflation to elicit that strength. Tomorrow’s report will include Average Hourly Earnings, and the expectation is for 2.7% annualized growth there in July. If this comes out really hot, we could see that Dollar strength extend. Outside of that – look to next week’s inflation report, also due on Friday, for that next bullish driver in the USD.
US Dollar via ‘DXY’ Four-Hour Price Chart

Chart prepared by James Stanley
EUR/USD Testing Below Wedge Support
This is an area to exercise some caution, as we have EUR/USD starting to test below the bottom of a symmetrical triangle that’s been building for the better part of the past month. About 80 pips below current price is the double bottom that printed in May and June at 1.1509, and a bearish break through here could be significantly more convincing for purposes of trend continuation. More attractive for moving forward, however, would be to let prices break 1.1500 and run lower to a fresh yearly low. At that point, traders can look to play a pullback to resistance (at prior support of 1.1509) for bearish continuation strategies.
EUR/USD Four-Hour Price Chart
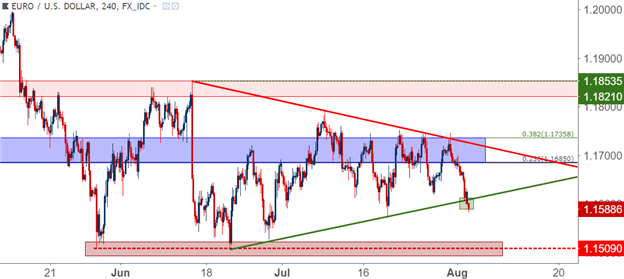
Chart prepared by James Stanley
GBP/USD – Can This Take Out 1.3000?
This morning brought a really interesting reaction to the pair after a really unclear rate hike out of the Bank of England. The BoE hiked rates, but if you were listening to the accompanying press conference, you may not have known that. The bank sounded pretty bearish and pessimistic, particularly as we approach Brexit negotiations between the EU and the UK. Mark Carney implied that with Brexit being ‘disinflationary’ and with a potential Hard Brexit scenario on the horizon, the BoE may need to cut rates before too long. This was said as the BoE had forecast a continuation of gradual, slow rate hikes with another 25 basis point adjustment before 2020.
The net takeaway was GBP weakness, and GBP/USD made a fast approach to the 1.3000 psychological level. We have yet to encroach upon the level, but this does keep the prospect of GBP/USD weakness as an attractive theme to work with as we move towards next week.
This is an area where USD weakness around tomorrow’s NFP report could be used to trigger into short GBP/USD positions should lower-high resistance come into play on the pair. We looked at the zone from 1.3083-1.3100 for support previously – that same area may be able to be repurposed as resistance around tomorrow’s NFP outlay.
GBP/USD Four-Hour Price Chart: Cable Slips After BoE Hikes Rates

Chart prepared by James Stanley
USD/JPY Catches Support, Remains Attractive for Long USD Theses
The pair that we’ve been following for USD-strength has been USD/JPY, and this setup caught a bullish breakout earlier in the week. The move pulled back to the zone that we looked at on Tuesday that runs from 111.40-111.60, and prices appear to have caught a higher-low. This keeps the door open for bullish continuation in USD/JPY.
USD/JPY Four-Hour Price Chart

Chart prepared by James Stanley
AUD/USD From Range Resistance to Range Support
This is another pair that could be interesting for USD-weakness scenarios, largely on the basis of the range that’s been at work over the past month-plus. We looked at resistance on Tuesday, and today we look into support.
AUD/USD Four-Hour Price Chart
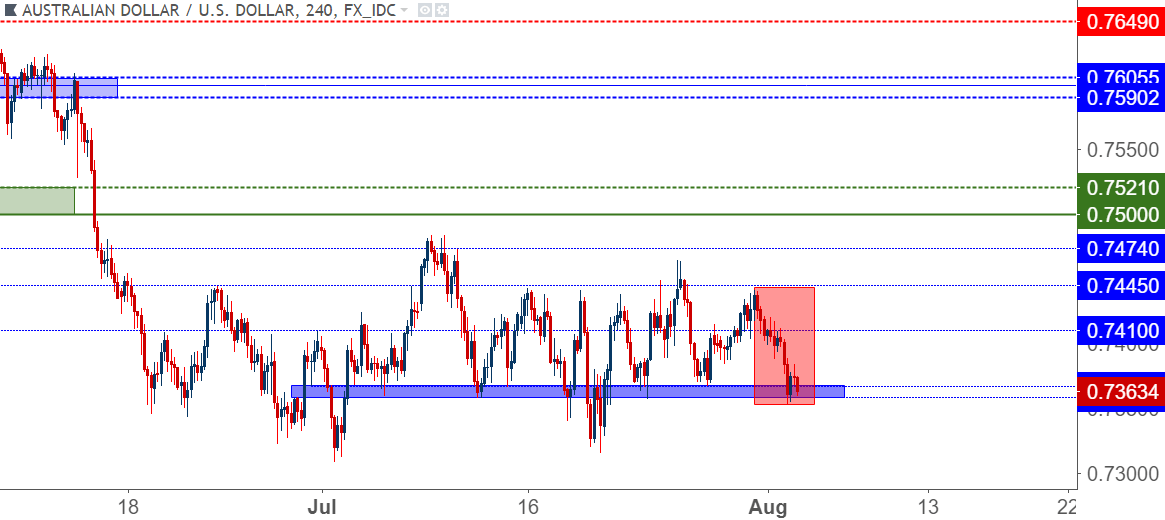
Chart prepared by James Stanley
USD/CAD Holding Around 1.3000 Brings Reversal Potential
We looked at USD/CAD testing support of 1.3000 on Tuesday, and since then we’ve seen multiple attempts from bears to push the pair lower – each of which have faltered. We’ve also seen a short-term higher-high, opening the door to the prospect of reversal in the pair should that pattern continue.
USD/CAD Hourly Price Chart: Higher-Low, Higher High Potential After Hold Around 1.3000
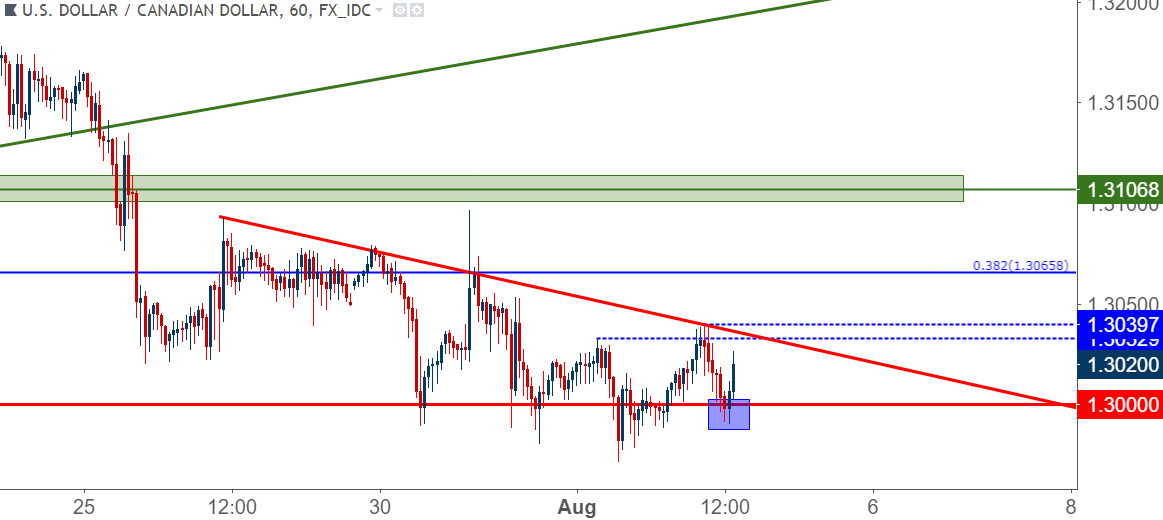
Chart prepared by James Stanley
Dow – Be Careful Around US Stocks As We Near Next Week’s Inflation Data
Probably one of the more clear takeaways from yesterday’s FOMC announcement was that US stocks aren’t all too excited about the prospect of a more positive, hawkish Fed. Futures prices in US equity indices posed a fairly visible drawdown through the Asian and European session, with the Dow Jones Industrial Average running into a key point of support that we looked into earlier in the week.
We looked at a support play earlier today, and prices have responded well at this point. But the larger fear is that the build of lower-lows and lower-highs on shorter-term charts may be preluding a deeper decline as we approach next week’s inflation data, set to be released on Friday.
Dow Jones Four-Hour Price Chart: Bounce From Support, But Lower-Lows and Lower-Highs

Chart prepared by James Stanley
To read more:
Are you looking for longer-term analysis on the U.S. Dollar? Our DailyFX Forecasts for Q1 have a section for each major currency, and we also offer a plethora of resources on USD-pairs such as EUR/USD, GBP/USD, USD/JPY, AUD/USD. Traders can also stay up with near-term positioning via our IG Client Sentiment Indicator.
Forex Trading Resources
DailyFX offers a plethora of tools, indicators and resources to help traders. For those looking for trading ideas, our IG Client Sentiment shows the positioning of retail traders with actual live trades and positions. Our trading guides bring our DailyFX Quarterly Forecasts and our Top Trading Opportunities; and our real-time news feed has intra-day interactions from the DailyFX team. And if you’re looking for real-time analysis, our DailyFX Webinars offer numerous sessions each week in which you can see how and why we’re looking at what we’re looking at.
If you’re looking for educational information, our New to FX guide is there to help new(er) traders while our Traits of Successful Traders research is built to help sharpen the skill set by focusing on risk and trade management.
--- Written by James Stanley, Strategist for DailyFX.com
Contact and follow James on Twitter: @JStanleyFX


