


Overall, the trading environment at the moment is a difficult one and conviction is lacking. The dollar has become a full-on chop-fest, but with a little more time a strong move is likely to develop. There are a couple of short-term charts in GBP cross-rates which hold appeal. Gold continues to try and forge a higher low amidst oversold conditions.
Technical Highlights:
- Overall trading conditions warrant caution
- USD choppy, EUR/USD triangulating
- GBP/CAD, GBP/NZD short-term set-ups
- Gold trying to cement higher low
To check out our intermediate-term fundamental and technical outlook on major markets and currencies, see out the DailyFX Q3 Forecasts.
Overall trading conditions warrant caution
We started off today’s webinar discussing the current trading environment as conditions haven’t been ideal for making aggressive maneuvers. A lot of choppy, indecisive price action out there, but the good news is that these periods of choppy trading turn into periods of extended price moves. It may take some time for this to become the case, so some patience in the meantime will be required. For those who favor trading ranges and fading levels, the current environment is solid for such strategies.
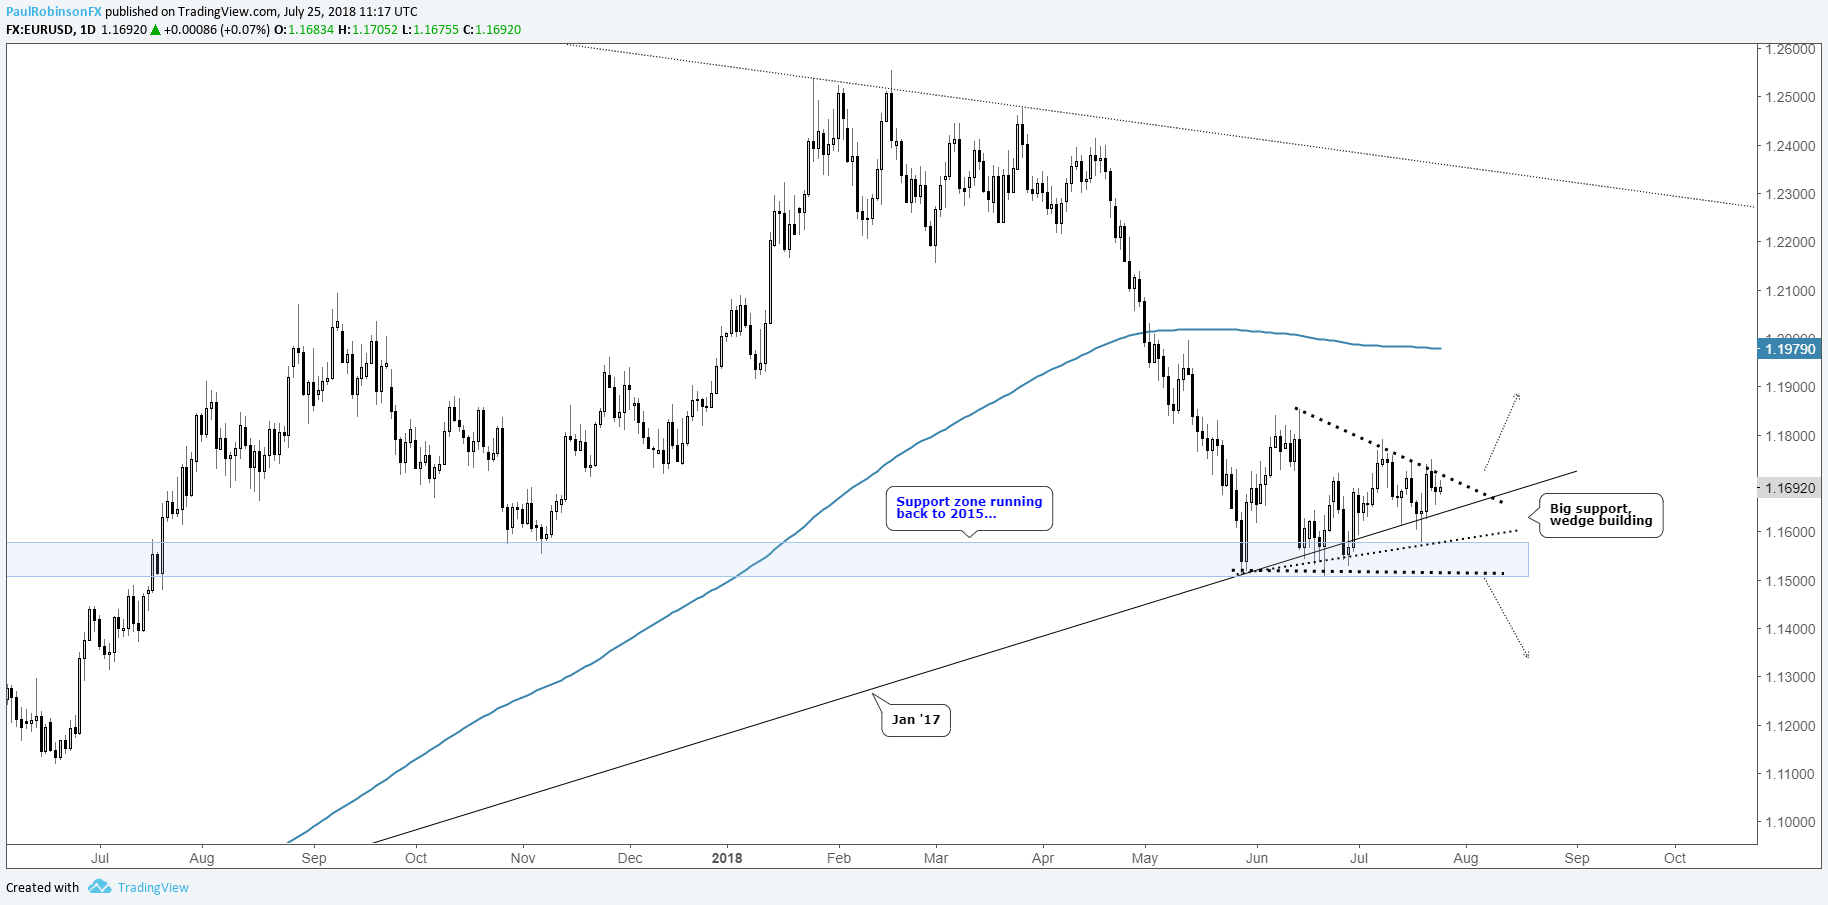
USD choppy, EUR/USD triangulating
Generally, it’s a chop-fest in the dollar-spectrum, with the likes of the euro and aussie highlighting some of the ‘worst’ price action. But the price sequence for the past six weeks in EUR/USD is beginning to take on the shape of a wedge; it could be symmetrical or descending in form, but the outcome may be all the same. The 11500 level is big for the euro, an eventual break will likely have momentum picking up in a significant way. A top-side breakout could unfold, but is viewed as the more difficult trade as the euro has to trade through prior levels up into the 11800s. For now, in ‘sit-and-wait’ mode.
EUR/USD Daily Chart (Wedging Up)
Check out the Q3 Euro Forecast for a broader fundamental and technical view
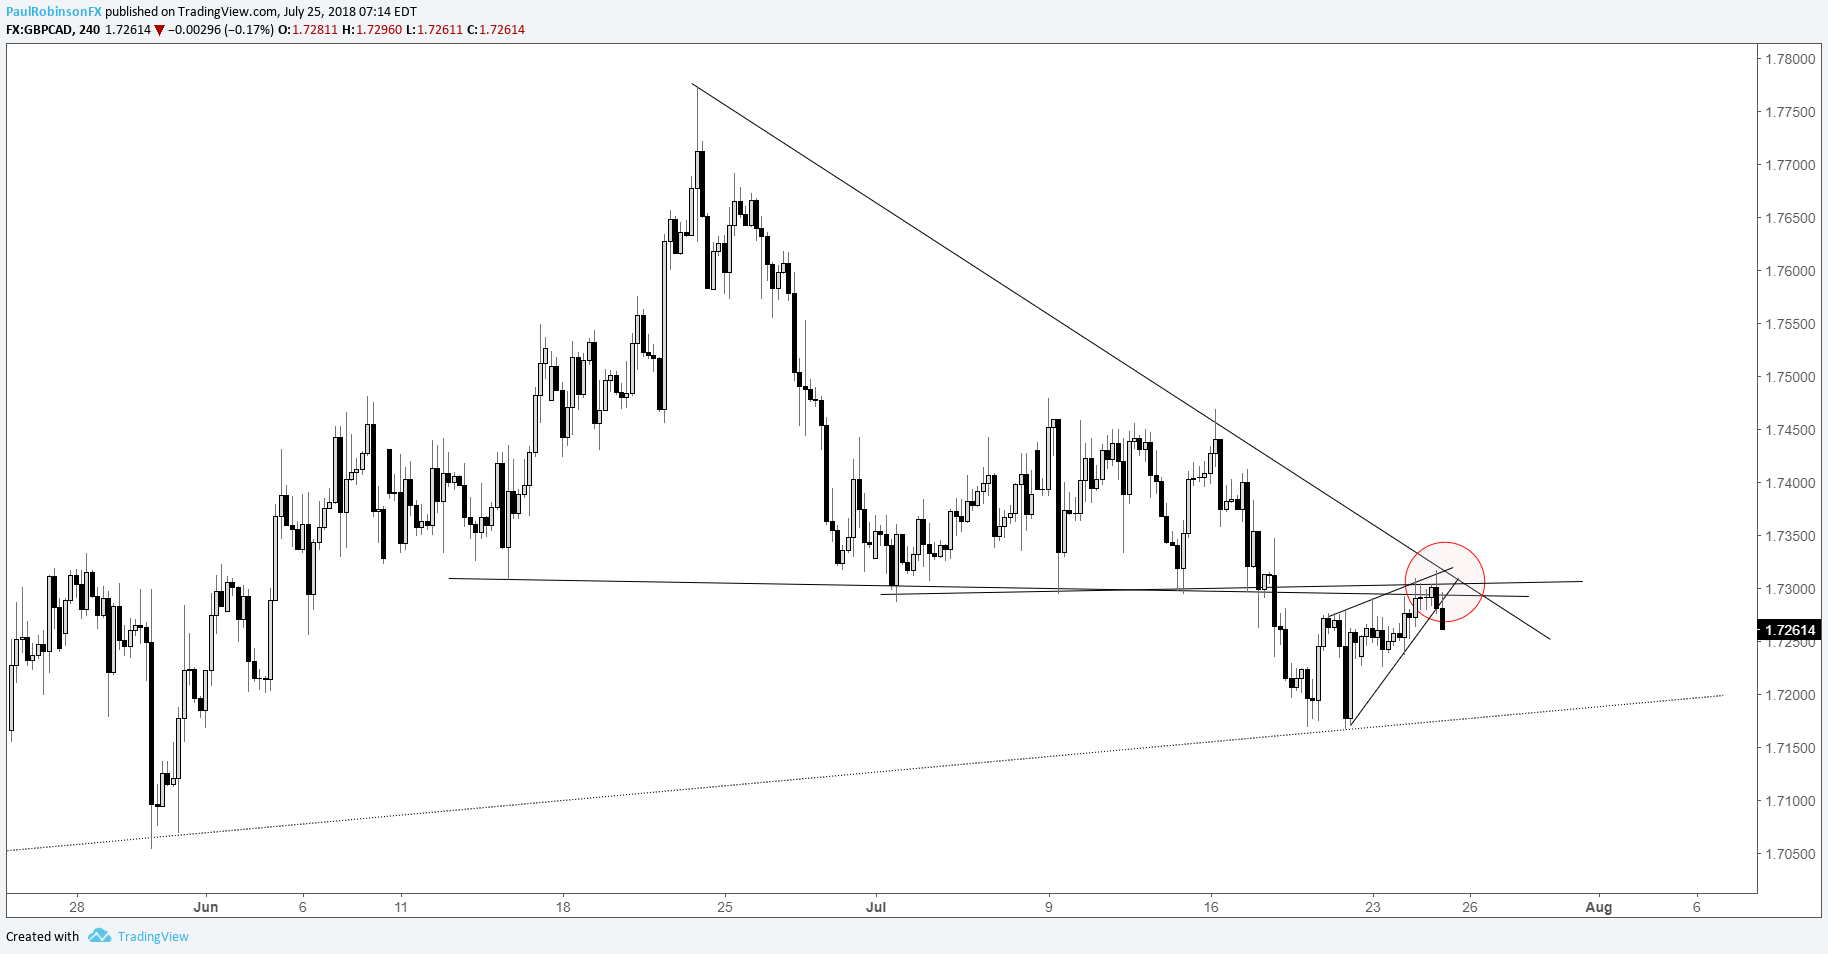
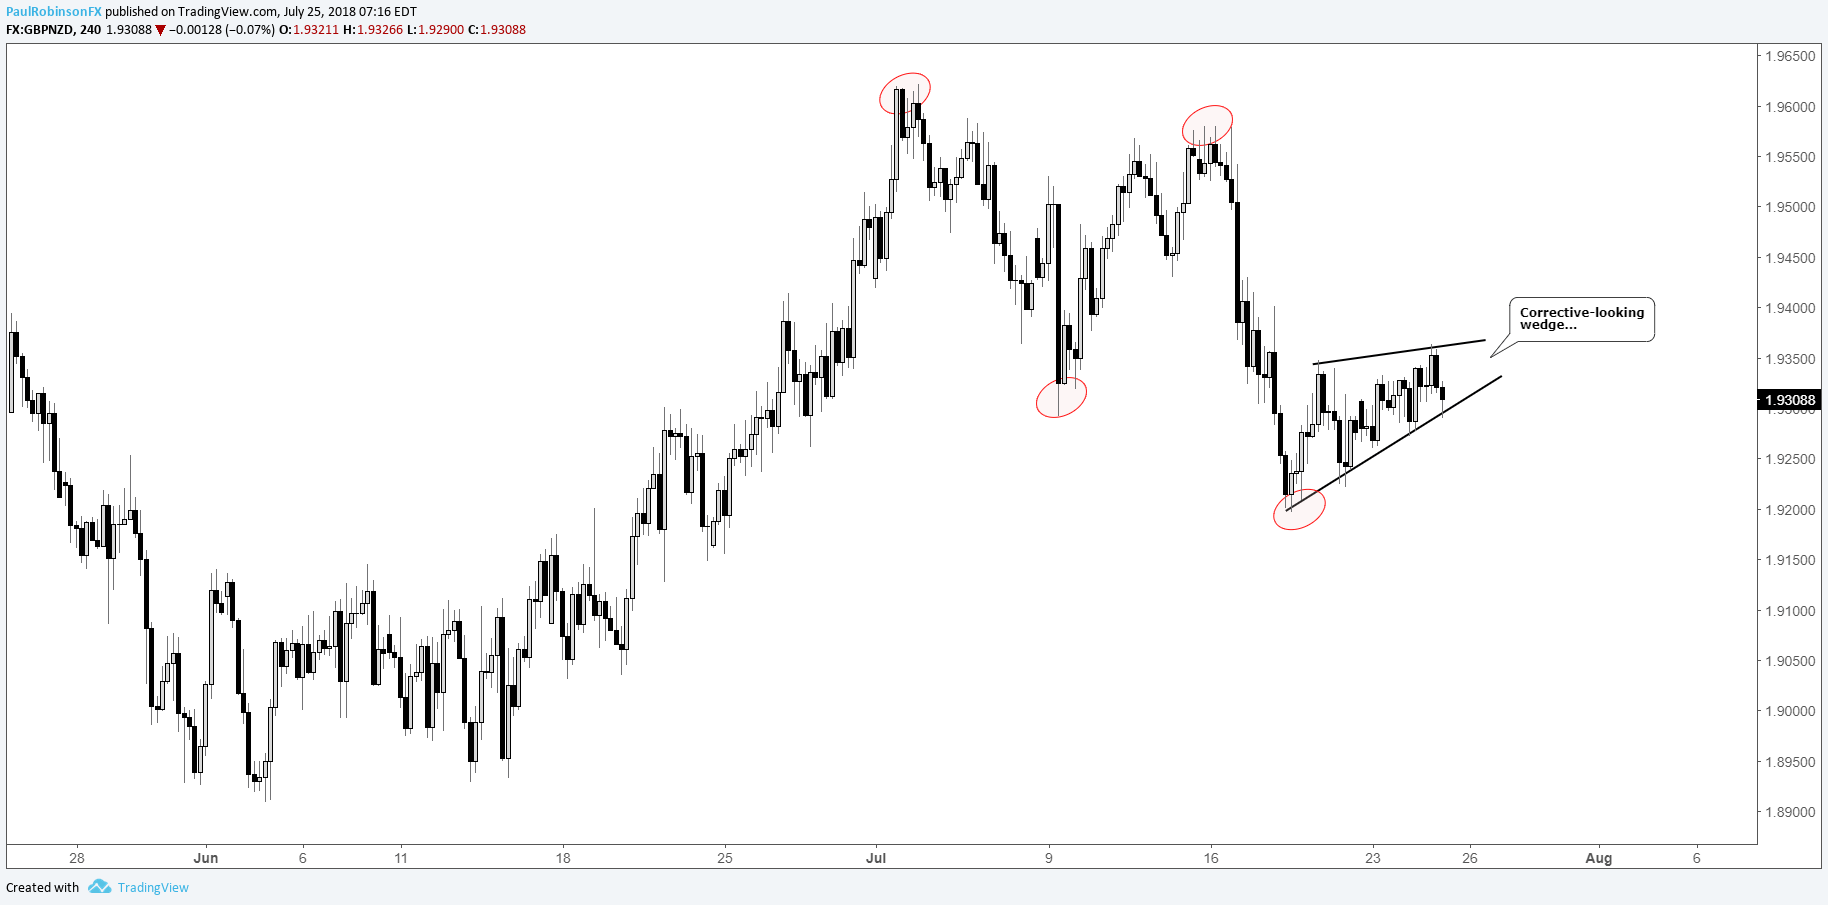
GBP/CAD, GBP/NZD short-term set-ups
These two GBP-crosses are presenting similar set-ups when looking at the 4-hr chart, in that they are both putting in what could be corrective wedges before trading lower. The apex of the pattern in GBP/CAD is situated at confluence of resistance. It may not be a big trade to the downside as there is support on the daily chart around the 17170-area, but enough potential for the nimble short-term trader. If we see momentum pick up on a decline, there is still the possibility for a larger daily break and an extended trade.
GBP/CAD 4-hr Chart (Rising wedge w/confluence of resistance)
Check out the Q3 GBP Forecast for a broader fundamental and technical view
Since July 2, GBP/NZD has been working lower in a sequence of lower highs and lower lows. The bounce off the most recent lower low is unfolding as a corrective wedge. It could always resolve itself higher, but should it break to the downside in-line with a weakening chart we’ll look for another lower low to quickly form.
GBP/NZD 4-hr Chart (Rising Wedge, weakening price sequence
Gold trying to cement higher low
Yesterday, we were discussing the possibility of gold carving out a higher low amidst oversold conditions. Yesterday’s stalemate day (forming a doji) during the retest is so far today leading to some follow-through. A little more is expected before gold may run into renewed problems; keep an eye on the 1238-area up to the underside of the recently broken Dec 2015 trend-line in the mid-1240s. Even if a bounce doesn’t fully develop, at the least gold looks headed for a time correction (horizontal price movement) in the near-term to work off oversold conditions.
Gold Price Daily Chart (Bounce into resistance?)

Check out the Q3 Gold Forecast for a broader fundamental and technical view
Resources for Index & Commodity Traders
Whether you are a new or an experienced trader, DailyFX has several resources available to help you; indicator for tracking trader sentiment, quarterly trading forecasts, analytical and educational webinars held daily, trading guides to help you improve trading performance, and one specifically for those who are new to forex.
---Written by Paul Robinson, Market Analyst
You can follow Paul on Twitter at @PaulRobinsonFX


