


Using Elliott Wave Theory our analysis for US Dollar Index and EURUSD hints at one last pop of USD strength. Then, we will consider a multi-month US Dollar correction to begin.
The video above is a recording of a US Opening Bell webinar from July 23, 2018. We focused on the Elliott Wave pattern for EURUSD among other US Dollar pairs. According to Elliott Wave Theory, US Dollar may be near a multi-month top.
US Dollar Index Elliott Wave Analysis
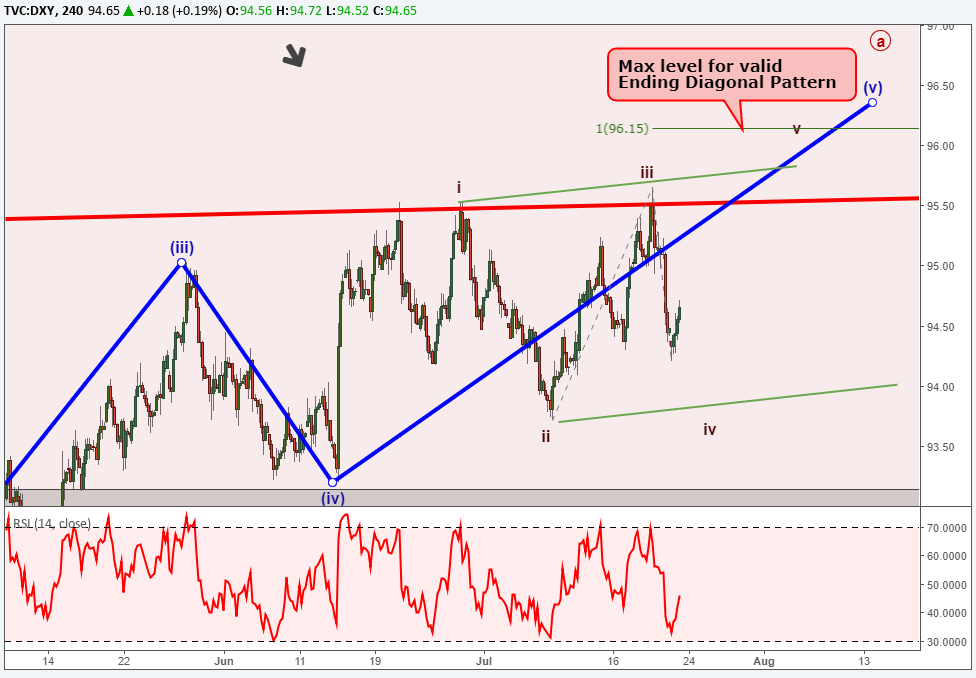
The Elliott Wave chart for US Dollar Index suggests we may see a mild new high but the Dollar advance is quite mature. It appears we are in a 5th wave of a larger wave ‘A’. This 5th wave appears to be carving out an ending diagonal pattern. Therefore, we have clues the market is providing us that this wave is a terminal wave where US Dollar may take a gasp of one more breath of air. This market is susceptible to a swift retracement.
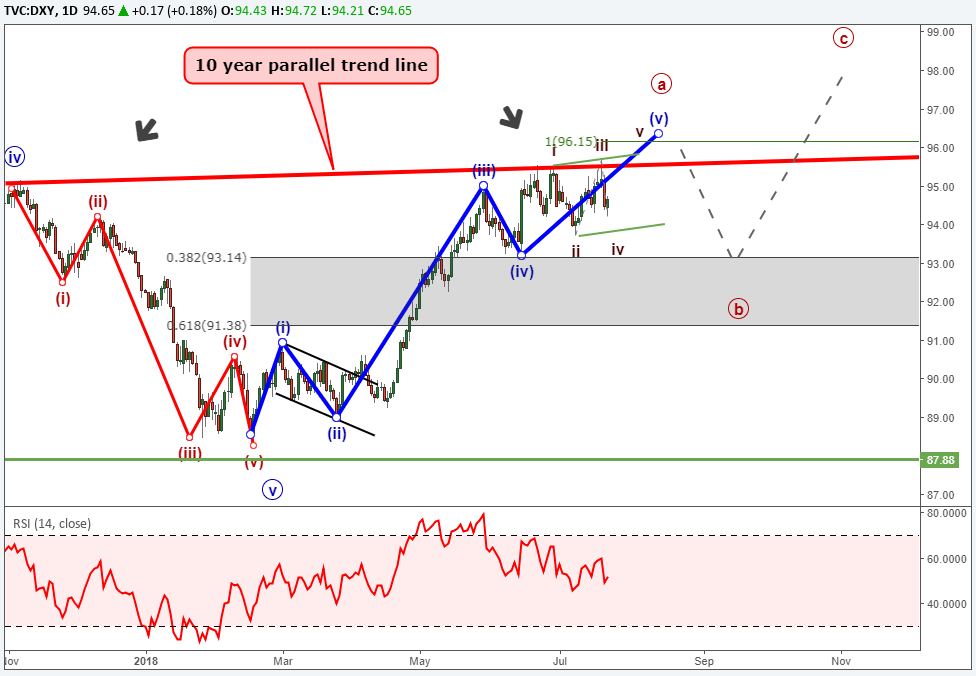
For those forex traders keeping score at home, the Elliott Wave diagonal pattern began June 14 and is nearly complete. So long as US Dollar Index holds below 96.15, then the market is at risk of a reversal to 93.19 and possibly lower levels.
EURUSD Elliott Wave Chart Hints at a small relief rally
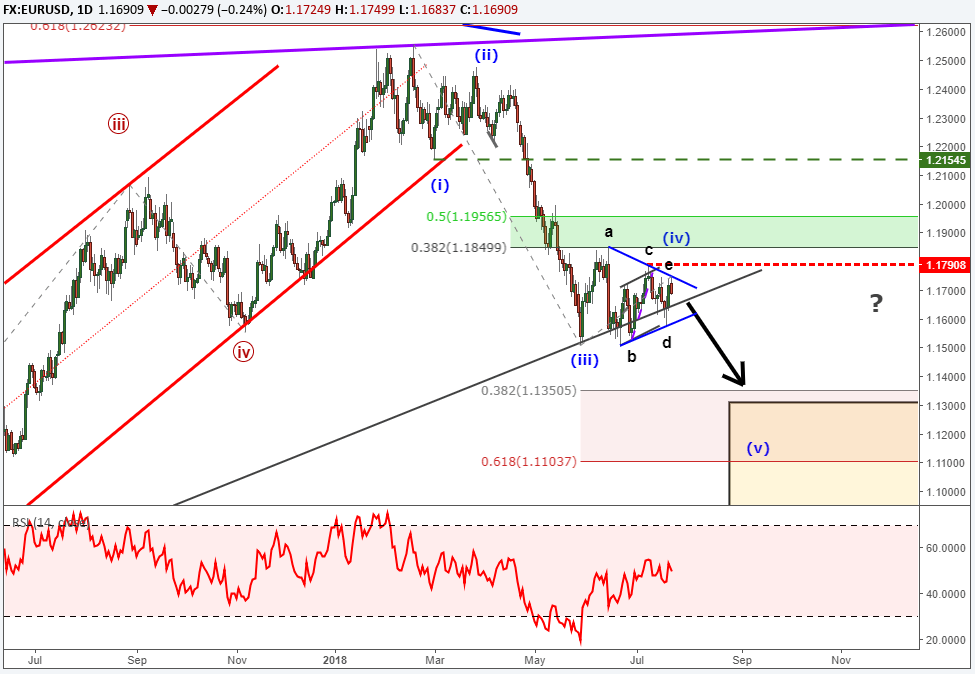
The EURUSD price chart continues to gyrate sideways in an Elliott Wave triangle pattern. We can count the pattern complete at today’s high so we are on high alert for a break lower out of the triangle.
The Elliott Wave triangle pattern is a symmetrical triangle and wave ‘e’ of the triangle has met the a-c trend line. We are counting this triangle as wave (iv) of a bearish impulse wave. Using wave relationships, we are anticipating a continued sell off to below 1.1510 that may reach 1.1350 and possibly 1.1100.
We have been short EURUSD with our first short entry at 1.2350 and our 2nd short entry at 1.2153 as prices hit our first target of 1.1554 on May 29. The Elliott Wave patterns still point towards lower levels so we hold we hold these short positions as wave (v) unfolds.
Elliott Wave Theory FAQs
What is an Elliott Wave ending diagonal pattern?
According to Elliott Wave Theory, there are several patterns to watch for. The diagonal pattern is a motive wave and carves in five waves. Each of the five waves are zigzags. Most of the time diagonals form in the 5th wave of an impulse of the ‘C’ wave of a zigzag or flat pattern. However, diagonals can form in the 1st wave or A position too.
We talk more about the construction and how to trade Elliott Wave diagonals in this hour-long recording.
If you are seeking further study into Elliott Wave Theory, read about our expert tips in our beginners and advanced trading guides.
How do I begin analyzing using Elliott Wave?
This is a common question of newer traders to Elliott Wave Theory. There are a couple of patterns I look for when starting my analysis. The Elliott Wave triangle pattern is one of those starting points because triangle form at certain spots within the Elliott Wave count. Therefore, if a triangle has been properly identified, we can then narrow the possibilities of the Elliott Wave count to begin to formulate higher probability patterns.
Learn more with “What is a Triangle Pattern in Elliott Wave Theory and How do you Trade it?”
After reviewing the guides above, be sure to follow future Elliott Wave articles to see Elliott Wave Theory in action.
You might also be interested in…
What is an Elliott Wave impulse wave and how do you trade it?
Forex Education : How do you begin counting Elliott Waves?
---Written by Jeremy Wagner, CEWA-M
Jeremy Wagner is a Certified Elliott Wave Analyst with a Master’s designation. Jeremy provides Elliott Wave analysis on key markets as well as Elliott Wave educational resources. Read more of Jeremy’s Elliott Wave reports via his bio page.
Communicate with Jeremy and have your shout below by posting in the comments area. Feel free to include your Elliott Wave count as well.
Discuss these markets with Jeremy in Monday’s US Opening Bell webinar.
Follow me on Twitter at @JWagnerFXTrader .


