


Using Elliott Wave Theory our analysis for US Dollar Index and EURUSD hints at additional USD weakness. Nasdaq bearish patterns suggest a turn would need to occur soon to remain valid.
The video above is a recording of a US Opening Bell webinar from July 9, 2018. We focused on the Elliott Wave pattern for EURUSD among other US Dollar pairs. According to Elliott Wave Theory, US Dollar may experience a correction in the next few days.
US Dollar Index Elliott Wave Analysis
The Elliott Wave chart for US Dollar Index points to further weakening of the US Dollar. We can count a completed impulse wave from mid-February 2018 to middle of June. As this impulse wave has completed, this suggests a mature up trend since the February 2018 low. Therefore, we would not be surprised to see a softening of the US Dollar back to 91-93.
From an Elliott Wave perspective this move lower likely corresponds as a ‘b’ wave. Therefore, we are considering it to be temporary weakness in the US Dollar prior to support emerging towards a new high above 96.

EURUSD Elliott Wave Chart Hints at a small relief rally
The EURUSD price chart continues to carve higher lows and lower highs over the past week. This essentially paints a consolidation picture for traders. Trends and consolidations of those trends do not last forever.
Last week we wrote how the pattern hints of a bump higher towards the 1.17-1.18 handle. That bump higher has taken place. However, based on the US Dollar Index chart above, the USD appears to have more weakening on its horizon. Therefore, even though prices have reached our potential reversal zone, we will not be interested in adding to the current short position yet awaiting even higher levels to print.
This forecast is valid so long as EURUSD price remains above 1.1528, the June 28 low. Though unexpected, if EURUSD drops below 1.1528, then we consider the near term bullish pattern negated and the potential for further losses to below 1.14.
We have been short EURUSD with our first short entry at 1.2350 and our 2nd short entry at 1.2153 as prices hit our first target of 1.1554 on May 29. The Elliott Wave patterns still point towards lower levels over the medium term though several short-term patterns hint at a bump higher to possibly 1.18.

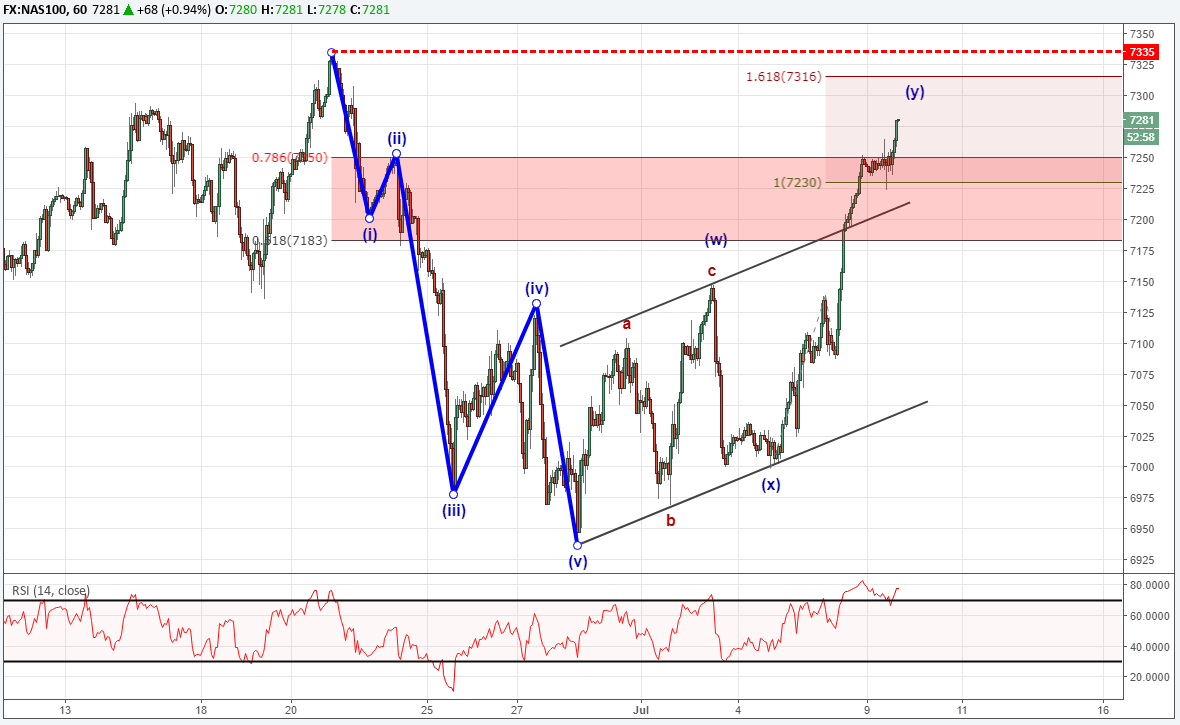
Nasdaq bearish pattern needs a pivot soon to remain valid
It appears we have a bearish impulse wave from the June 20 high to the June 28 low. Therefore, we are anticipating a three wave move to terminate near current levels while holding below 7335. This would be an Elliott Wave 5-3 pattern and therefore is bearish.
Nasdaq has exceeded the 78.6% retracement level, so the warning lights on the dashboard are flashing that this bear pattern may not work out. A break above 7335 would void the bearish pattern and indicate some other Elliott Wave pattern is at play.
Elliott Wave Theory FAQs
What are Elliott Wave impulse waves?
According to Elliott Wave Theory, the market moves five waves in the direction of the near term trend followed by a three wave counter trend wave. An impulse wave is one of two types of motive waves that denotes trend direction. Therefore, if we see a bearish impulse waveform, then after a three-wave counter trend wave, we can anticipate at least one more bearish motive wave.
If you are seeking further study into Elliott Wave Theory, read about our expert tips in our beginners and advanced trading guides.
After reviewing the guides above, be sure to follow future Elliott Wave articles to see Elliott Wave Theory in action.
What is the biggest mistake traders make?
Regardless of the style of analysis, many traders do lose money because they do not take the time to study the market and the effect of leverage. At DailyFX, we have studied millions of live trades and boiled our study down into a Traits of Successful Traders guide. You will find how leverage and human nature affects our trading so you can be better prepared for the next correction.
Elliott Wave Theory can be applied to a variety of highly liquid markets. FX is one of my favorite markets to apply the Elliott Wave principle. Learn more about trading FX with this guide specifically designed for you.
You might also be interested in…
What is an Elliott Wave impulse wave and how do you trade it?
Forex Education : How do you begin counting Elliott Waves?
---Written by Jeremy Wagner, CEWA-M
Jeremy Wagner is a Certified Elliott Wave Analyst with a Master’s designation. Jeremy provides Elliott Wave analysis on key markets as well as Elliott Wave educational resources. Read more of Jeremy’s Elliott Wave reports via his bio page.
Communicate with Jeremy and have your shout below by posting in the comments area. Feel free to include your Elliott Wave count as well.
Discuss these markets with Jeremy in Monday’s US Opening Bell webinar.
Follow me on Twitter at @JWagnerFXTrader .


