


Several key players in the USD-spectrum are coiling up into wedges; EUR/USD, GBP/USD, and USD/JPY are all coiling up to varying degrees. Depending on things unfold in the days ahead, there could be a good trade to come out of at least one of them. Gold is quickly approaching a major inflection point, be on the watch for volatile price action.
Technical Highlights:
- EUR/USD descending wedge forming
- GBP/USD falling wedge on the build
- USD/JPY symmetrical triangle nearing apex
- Gold is very near a major inflection point
For longer-term trading ideas, forecasts (Q3 coming this weekend), and a library of educational content, check out the DailyFX Trading Guides.
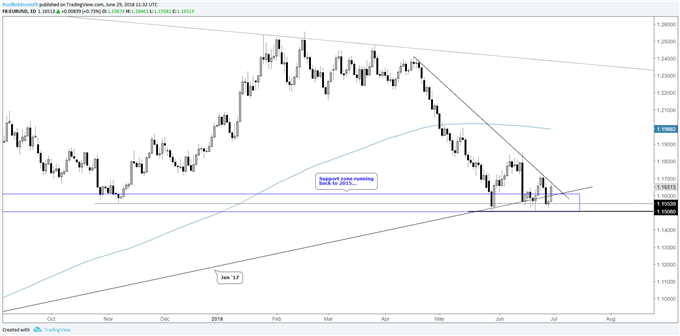
EUR/USD descending wedge forming
For the past month the euro has been bouncing around off long-term support (top of the range from 2015/16), with each bounce so far becoming increasingly weaker. This has price bottled up into a descending wedge. Ideally, given the trend, descending nature of the wedge, and big support, a breakdown would likely lead to the more explosive move, but we can’t rule out a top-side breakout. The short is likely to be the ‘easier’ play, but we’ll maintain flexibility in the event of a bullish break.
EUR/USD Daily Chart (Descending wedge on big support)
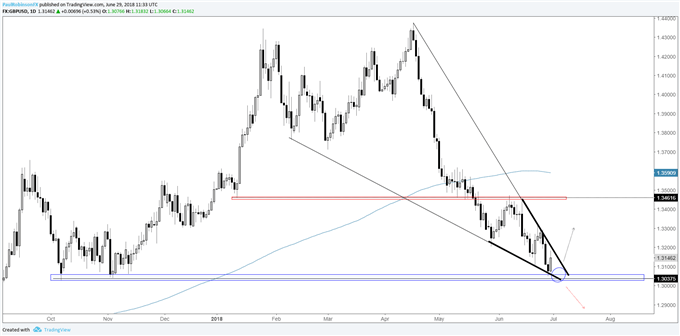
GBP/USD falling wedge on the build
GBP/USD has a pair of intermediate-term trend-lines which given their angle is creating a short-term falling wedge. The development of the wedge comes at support from Oct/Nov, which wind up as the floor should we see a top-side breakout of the pattern.
Given the extended decline and nature of these explosive patterns, a relatively explosive rally could unfold if the upper trend-line is broken. Traders have perhaps become all too comfortable shorting cable, with the ‘Johnny-come-lately’ crowd getting squeezed. There are a couple of scenarios (a breakdown could take shape), but this is the most tantalizing. Waiting for a confirmed break will be the key.
GBP/USD Daily Chart (Falling wedge)
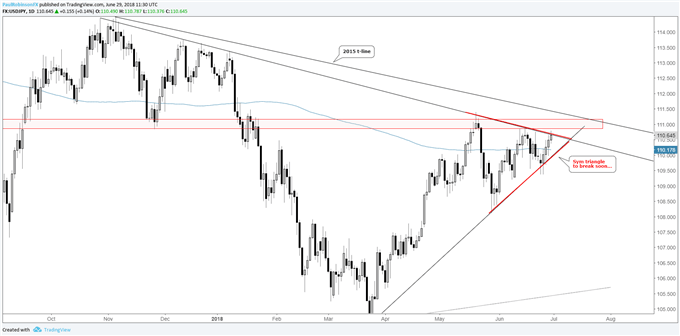
USD/JPY symmetrical triangle nearing apex
USD/JPY has spent the past 5 weeks or so bobbling back and forth between trend-lines, forming a symmetrical triangle. The trend prior to its development suggests an upside breakout could be on its way, but a steadfast downtrend line from 2015 could prove problematic shortly after a breakout. To run with a bullish bias a breakout of the triangle and weekly close above the trend-line is needed. A downside break won’t require the same stringent weekly bar criteria.
See the IG Client Sentiment page for how sentiment changes can help you better gauge market direction.
USD/JPY Daily Chart (Symmetrical triangle)
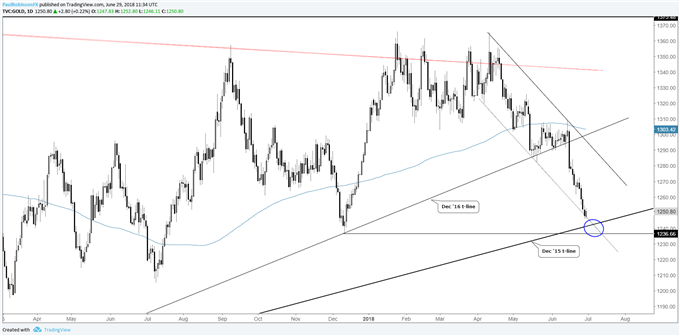
Gold is very near an important inflection point
As we wrote this morning, gold is quickly closing in on a major trend-line test. Rising up from December 2015 is a trend-line that also constitutes the bottom of a long-term wedge pattern. Indeed, a big spot, not to mention in confluence is the December low at 1236. Hold or fold? For more details, see today’s gold & silver commentary.
Gold Daily Chart (Approaching big support)
Resources for Forex & CFD Traders
Whether you are a new or an experienced trader, DailyFX has several resources available to help you; indicator for tracking trader sentiment, quarterly trading forecasts, analytical and educational webinars held daily, trading guides to help you improve trading performance, and one specifically for those who are new to forex.
---Written by Paul Robinson, Market Analyst
You can follow Paul on Twitter at @PaulRobinsonFX


