


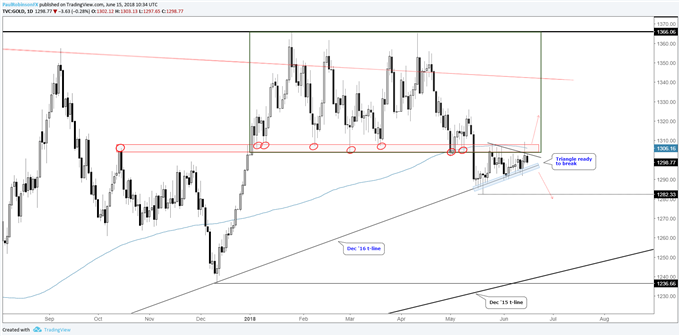
Looking ahead to next week, there is reason to believe we could be in for more weakness in JPY pairs as yen strength picks up momentum. Aussie is a set-up we’ve been tracking to the downside and with the broader pattern triggered the trading is bias is from the short-side. Gold was firmly rejected on an attempt to break resistance, it’s working closer to a sustained breakout.
Technical Highlights:
- USD/JPY at resistance on daily, 4-hr technical pattern
- Yen cross-rates on verge of picking up more downside momentum
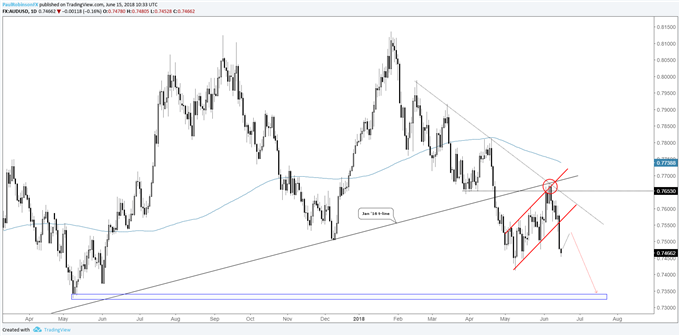
- AUD/USD bear-flag broken, trading bias is lower
- Gold rejected lower, still winding up for a move soon
In a slump right now or want ideas for when the inevitable slump arrives? (It happens to everyone) Check out these 4 ideas for restoring and maintaining confidence.
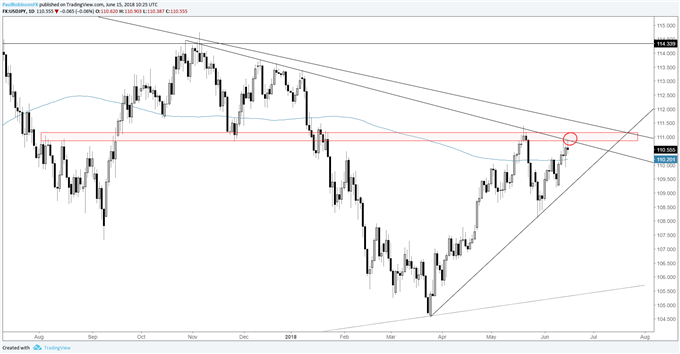
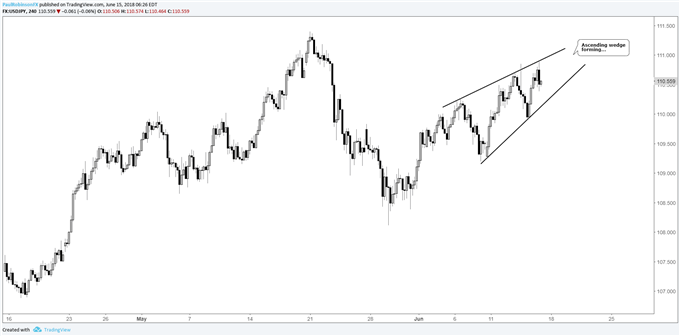
USD/JPY at resistance on daily, 4-hr technical pattern
USD/JPY is currently trading at a confluence of trend-line and price zone resistance on the daily time-frame. Pulling in closer, on the 4-hr chart, there is a rising wedge forming which suggests a breakout is coming soon. A break to the downside will have a rejection from resistance confirmed and likely have USD/JPY rolling downhill. A breakout above ~11180 is needed to clear all resistance.
USD/JPY Daily Chart (Resistance)
See the IG Client Sentiment page for how sentiment changes can help you better gauge market direction.
USD/JPY 4-hr Chart (Rising Wedge)
Yen cross-rates on verge of picking up more downside momentum
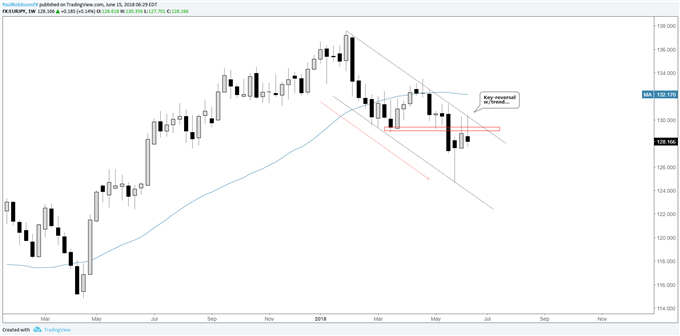
Yen cross-rates were swiftly hit last week, and barring any significant rallies between the time of this writing and the end of today’s session, there will be key-reversal bars on the weekly time-frame in the direction of the trend across the group.
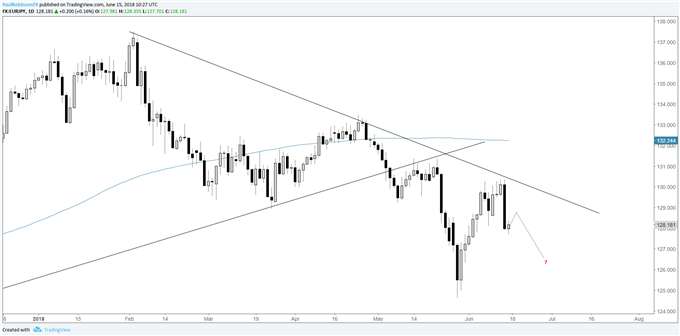
A couple that we looked at were EUR/JPY and AUD/JPY. The former not only is about to post its second weekly reversal (with this week’s the most important), but also made a slight lower-low from last week. The trading bias is to the downside with rallies seen as likely to fail.
Enjoy the recording? Come join Paul or any of the other analysts live next week – check out the Webinar Calendar for details.
EUR/JPY Weekly Chart (Reversing with trend)
EUR/JPY Daily Chart (Momentum lower, rallies vulnerable)
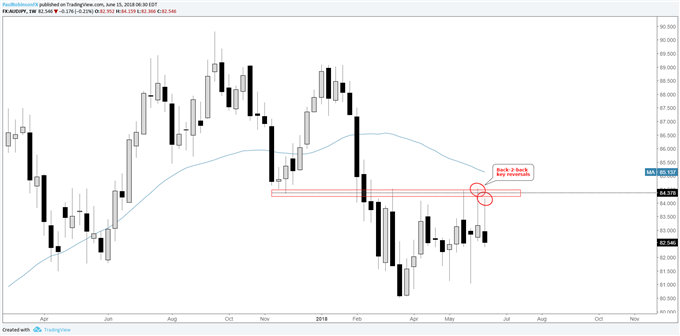
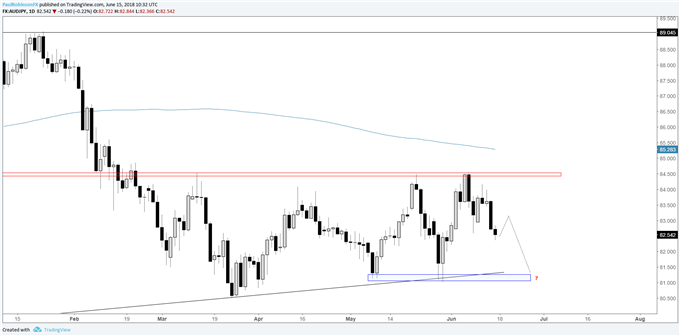
AUD/JPY posted (again, assuming no major turnarounds) its second key-reversal in a row on the weekly chart; follow-through looks to be in store for next week. There is room to go before the low-end of the range dating back to March is met. Like EUR/JPY, a lower low on the daily was also carved out from last week.
AUD/JPY Weekly Chart (Reversal Bars in direction of trend)
AUD/JPY Daily Chart (Room to go before support)
AUD/USD bear-flag broken, trading bias is lower
This is a set-up we’ve been tracking as of recent, with AUD/USD having now broken the underside trend-line off the bear-flag, we’re looking for further weakness from here. The approach on this end is to look for a bounce first, then join in short with a targeted objective of around 7330, or the May 2017 low.
AUD/USD Daily Chart (Bear-flag triggered)
Gold rejected, still winding up for a move soon
Gold tried to break back inside the multi-month range, but was swiftly rejected with the dollar surging post-ECB. This still maintains the coiling price action on the daily between the bottom of the range and the December 2016 trend-line; looking for one side to give-way very soon.
Gold Daily Chart (Rejection, breakout likely soon)
Resources for Forex & CFD Traders
Whether you are a new or an experienced trader, DailyFX has several resources available to help you; indicator for tracking trader sentiment, quarterly trading forecasts, analytical and educational webinars held daily, trading guides to help you improve trading performance, and one specifically for those who are new to forex.
---Written by Paul Robinson, Market Analyst
You can follow Paul on Twitter at @PaulRobinsonFX


