


Gold price finally broke the multi-month range last week but is now finding support on a key trend-line. A retest of range-break may be in store and offer a spot for fresh shorts. Crude oil is nearing the breakpoint of a rising wedge, a couple of scenarios to watch there. The FTSE is extended into a point of potential opposition.
Technical Highlights:
- Gold bouncing from 2016 t-line, watch range retest
- Crude oil rising wedge points to a rise in volatility
- FTSE extended into top-side t-line, pullback due
For in-depth fundamental and technical analysis for your favorite market or currency, check out the DailyFX Forecasts.
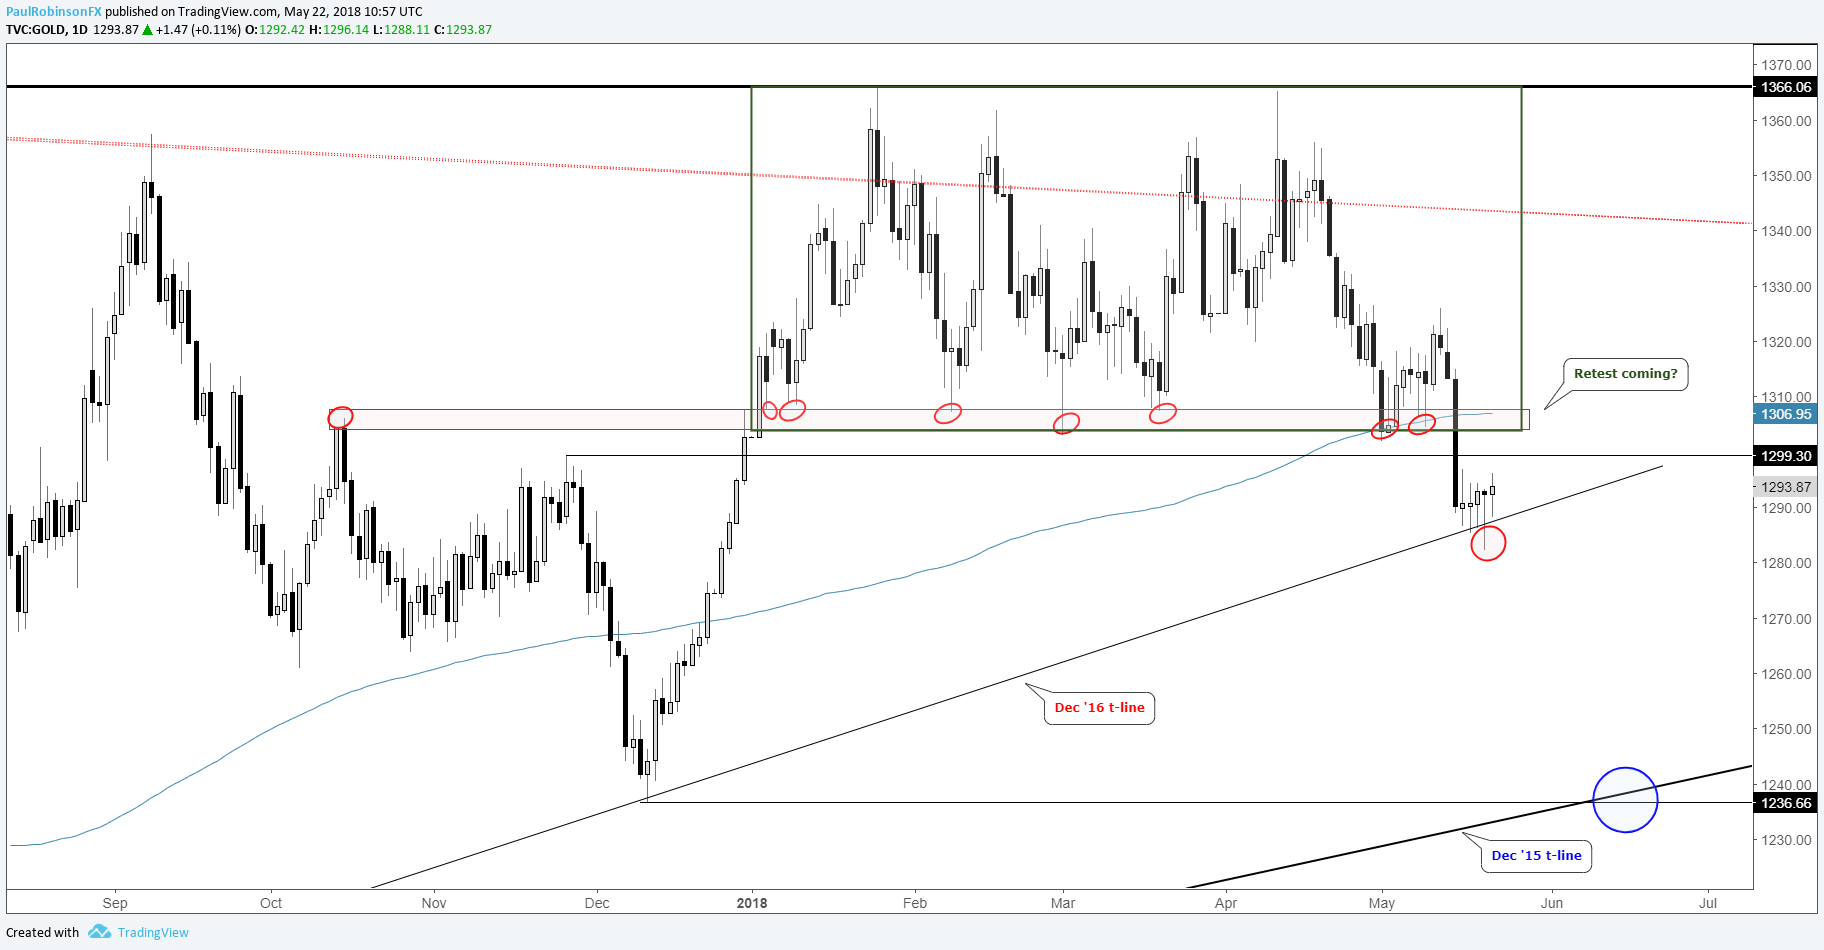
Gold bouncing from 2016 t-line, watch range retest
Gold posted a bullish key-reversal bar yesterday in-line with the reversal seen in USD. The reversal came on an attempt to break through the December 2016 trend-line, helping further that line of support along as a key threshold to watch moving forward.
A bounce from here will have the bottom of the multi-month range squarely in focus as a major obstacle for gold to overcome. A test of the low-1300s could offer traders a solid risk/reward opportunity for what appears likely to become an extended move lower after breaking out of the 5 ½ month range.
Gold Daily Chart (2016 t-line, range retest?)
For the intermediate-term fundamental/technical outlook, check out the Gold Forecast
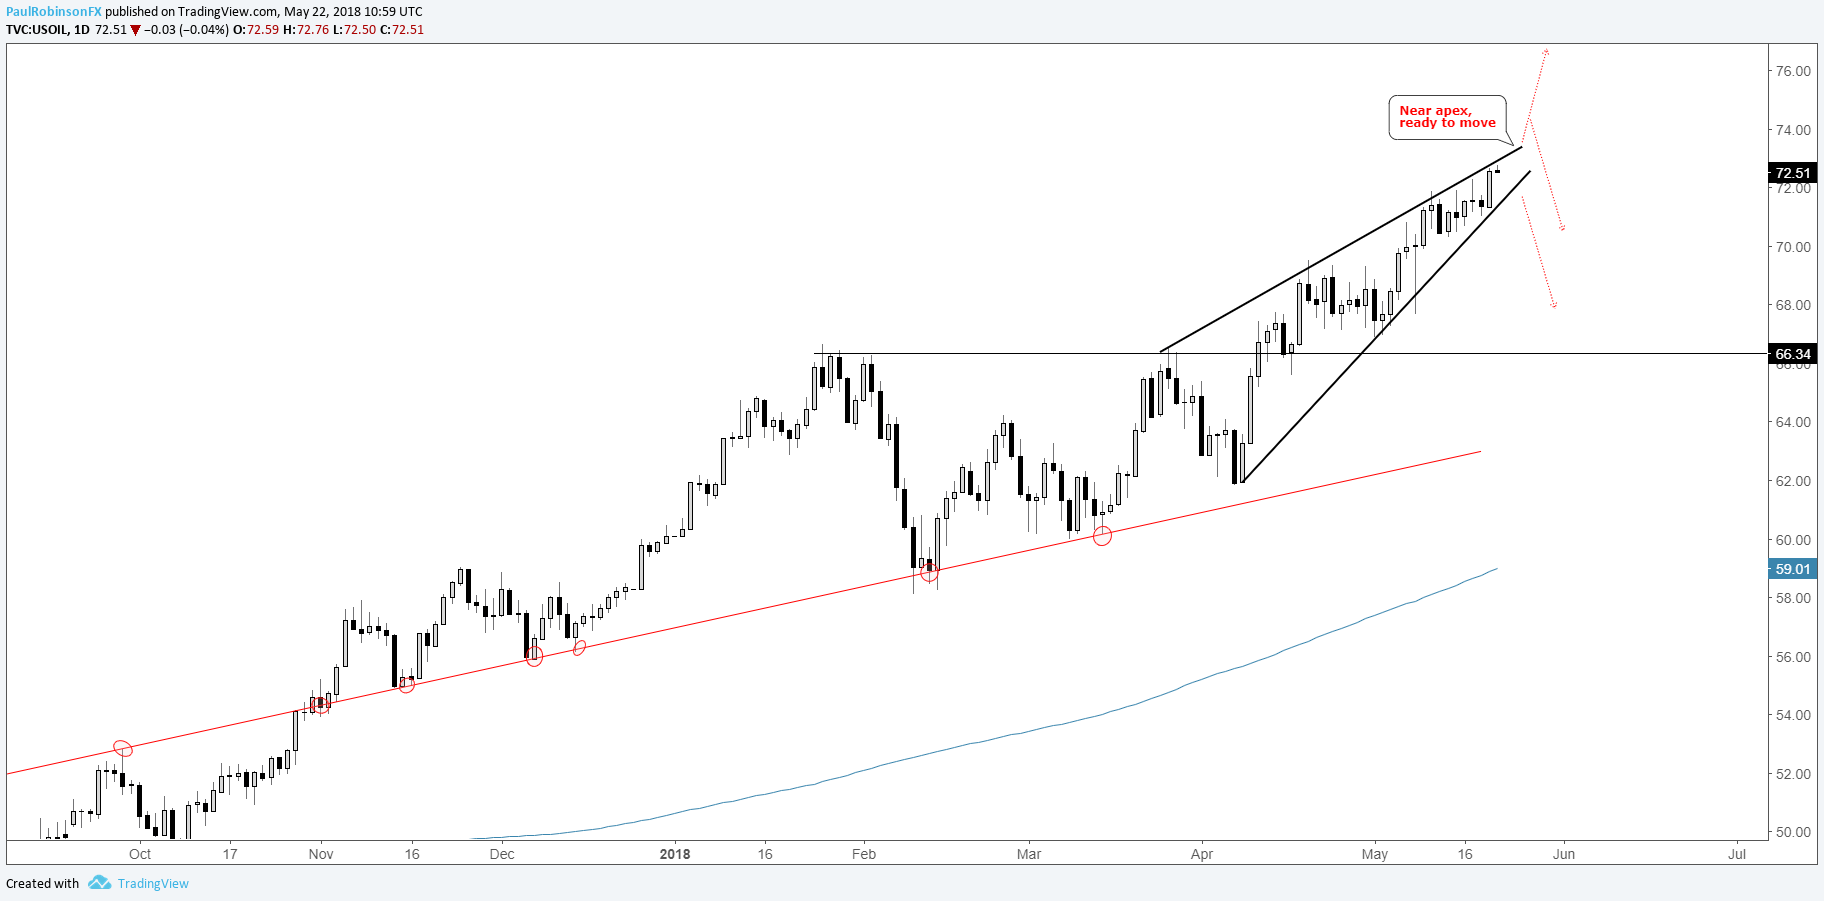
Crude oil rising wedge points to a rise in volatility
The WTI crude oil contract is quickly closing in on what could become an explosive move in the days ahead. The rising wedge dating back to March is set to soon trigger. We discussed three specific scenarios which may unfold.
The first, is that we see the funnel higher turn into a blow-off top, indicating the end of what has been a fairly relentless rise since last year. In this scenario, the move could be fierce before momentum stalls. The second possibility, is for oil to decline below the underside trend-line of the pattern and trade down to support around 66 in fairly short order.
The third scenario we discussed, is for a fake-out breakout to take shape to the top-side followed by a decline beneath the underside trend-line. This would likely be the most bearish of the three outcomes from a short-term perspective, as fresh buyers are sucked in before the rug is yanked out from underneath.
In any case, we need to be patient and take a reactionary stance as apposed to predicting which one will develop. Once we see how things are most likely to play out we can take it from there.
US Crude Oil Daily Chart (Rising wedge)
For the intermediate-term fundamental/technical outlook, check out the Crude Oil Forecast
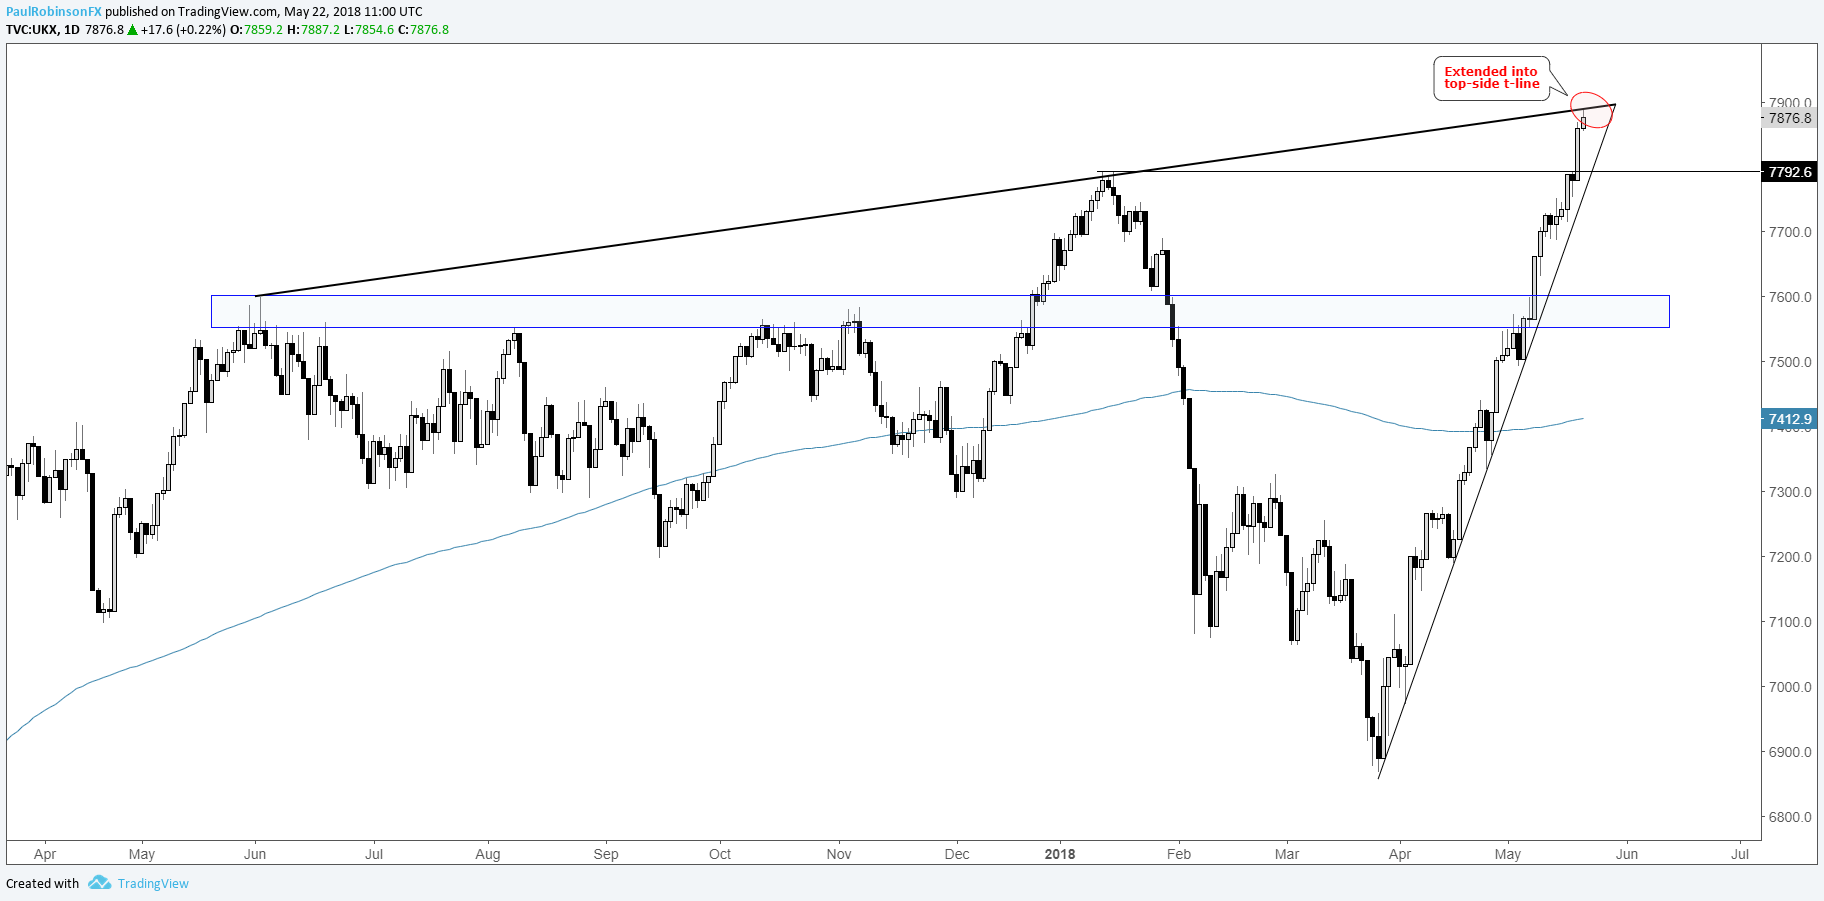
FTSE extended into top-side t-line, pullback due
The relentless rise in the FTSE has without question been one of the headline moves in major global stock markets. The coupling of firmer risk appetite and a weak sterling have significantly bolstered the index. The new record highs notched in recent days looks at risk, though.
There is a nearly one-year long top-side trend-line which the FTSE is currently trading at. Between the extended nature of the index (only single day pullbacks in the past month+) and resistance, it looks like we may finally see a consolidation or pullback develop. The first level of support to watch is the old record high just under 7800.
FTSE Daily Chart (Extended into top-side trend-line)
For the intermediate-term fundamental/technical outlook, check out the Global Equity Indices Forecast
Resources for Index & Commodity Traders
Whether you are a new or an experienced trader, DailyFX has several resources available to help you; indicator for tracking trader sentiment, quarterly trading forecasts, analytical and educational webinars held daily, trading guides to help you improve trading performance, and one specifically for those who are new to forex.
---Written by Paul Robinson, Market Analyst
You can follow Paul on Twitter at @PaulRobinsonFX


