


Gold has been pushed down towards the bottom of the ongoing range, and while it could soon break we must still respect support. Crude oil is still pointed higher with support below. The DAX & FTSE are at resistance, while U.S. indices are still at risk of significant tops.
Technical Highlights:
- Gold near bottom of big range, but may not hold
- Crude oil still positioned bullishly
- DAX, FTSE at resistance; Dow descending wedge still in play
For in-depth fundamental and technical analysis for your favorite market or currency, check out the recently released DailyFX Q2 Forecasts.
Gold near bottom of big range, but may not hold
Last week, gold dropped down to the bottom of the range in place so far this year, along with the 200-day MA which passes right through the thick of support. A break of support on further USD strength looks likely, but we will respect support until broken.
With that in mind, those looking for the range to continue, current levels are attractive for longs, however; in the event we see a breakdown the next area of key support won’t arrive until the trend-line rising up from December 2016 under the low created in December 2017. A break will help clear a path for short-term shorts.
Gold Daily Chart (Range intact for now)

For the intermediate-term fundamental/technical outlook, check out the Q2 Forecast for Gold
Crude oil still positioned bullishly
Crude oil continues to generally be a beast with the trend still pointed firmly higher. Not far below is support via the tops of the recent consolidation and trend-line extending higher from last month. This may offer an attractive spot to look for a continuation higher.
One bearish scenario to consider would be for oil to continue funneling higher and the development of a rising wedge. However, this could result in another thrust higher, so waiting for a fully developed pattern along with a break will be most prudent. For now, sticking with the trend.
US Oil Daily Chart (Tilted higher, support below)

For the intermediate-term fundamental/technical outlook, check out the Q2 Forecast for Crude Oil
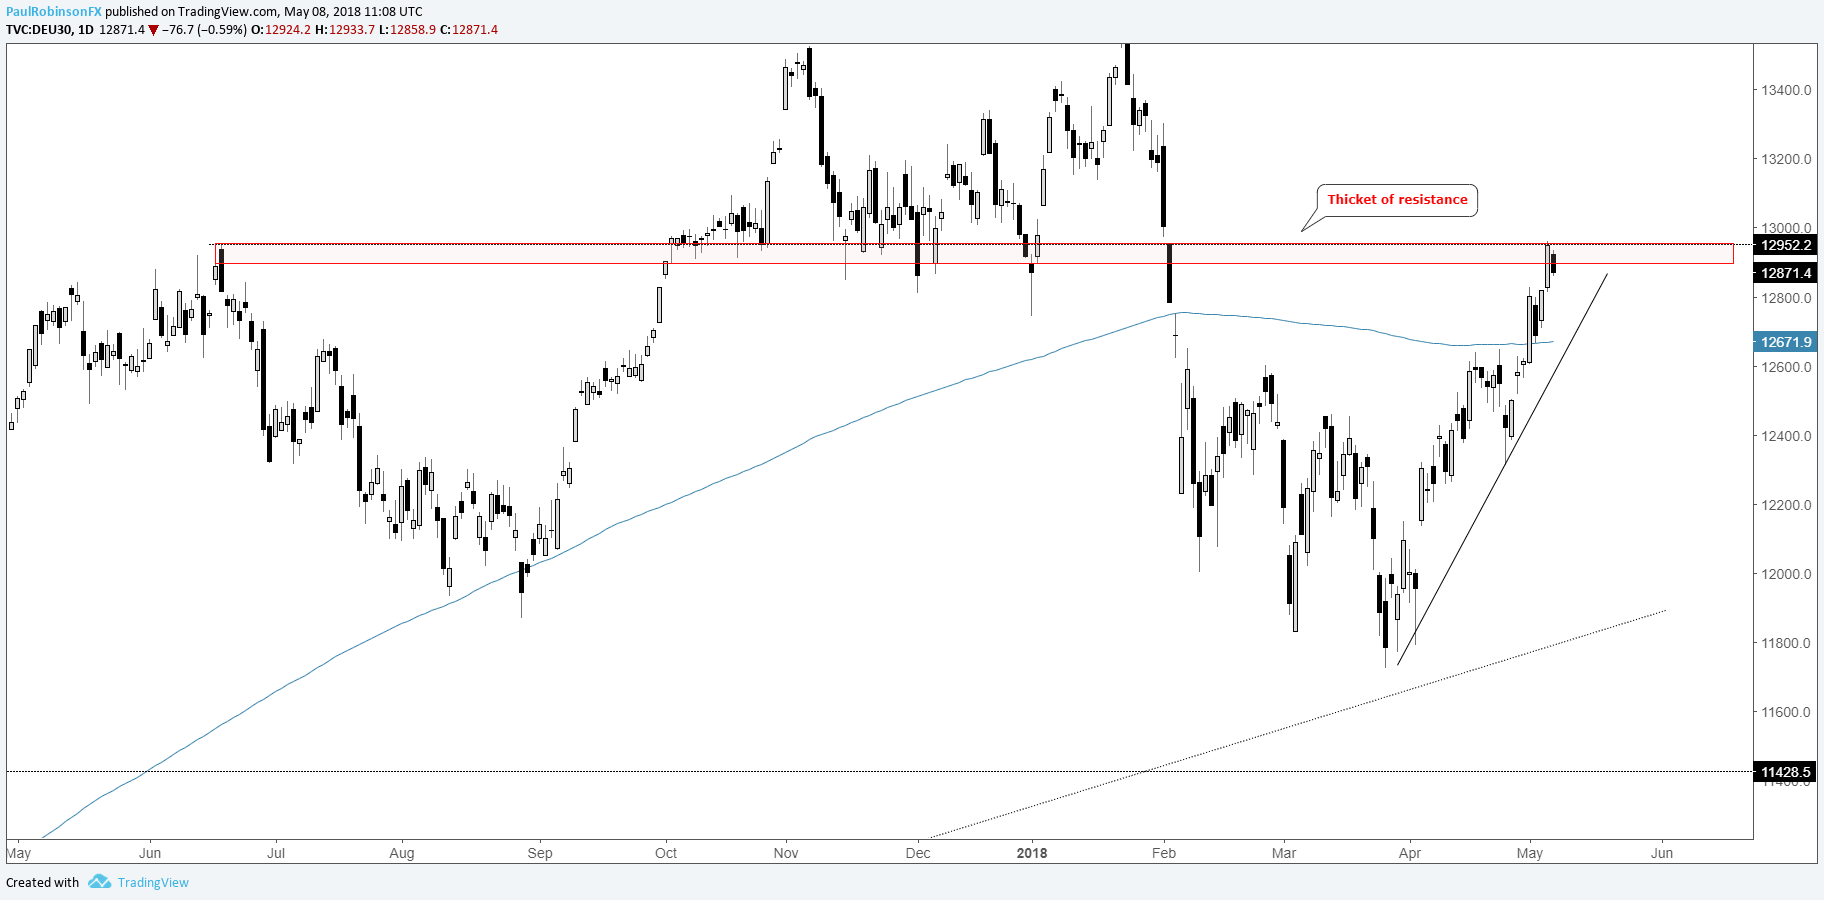
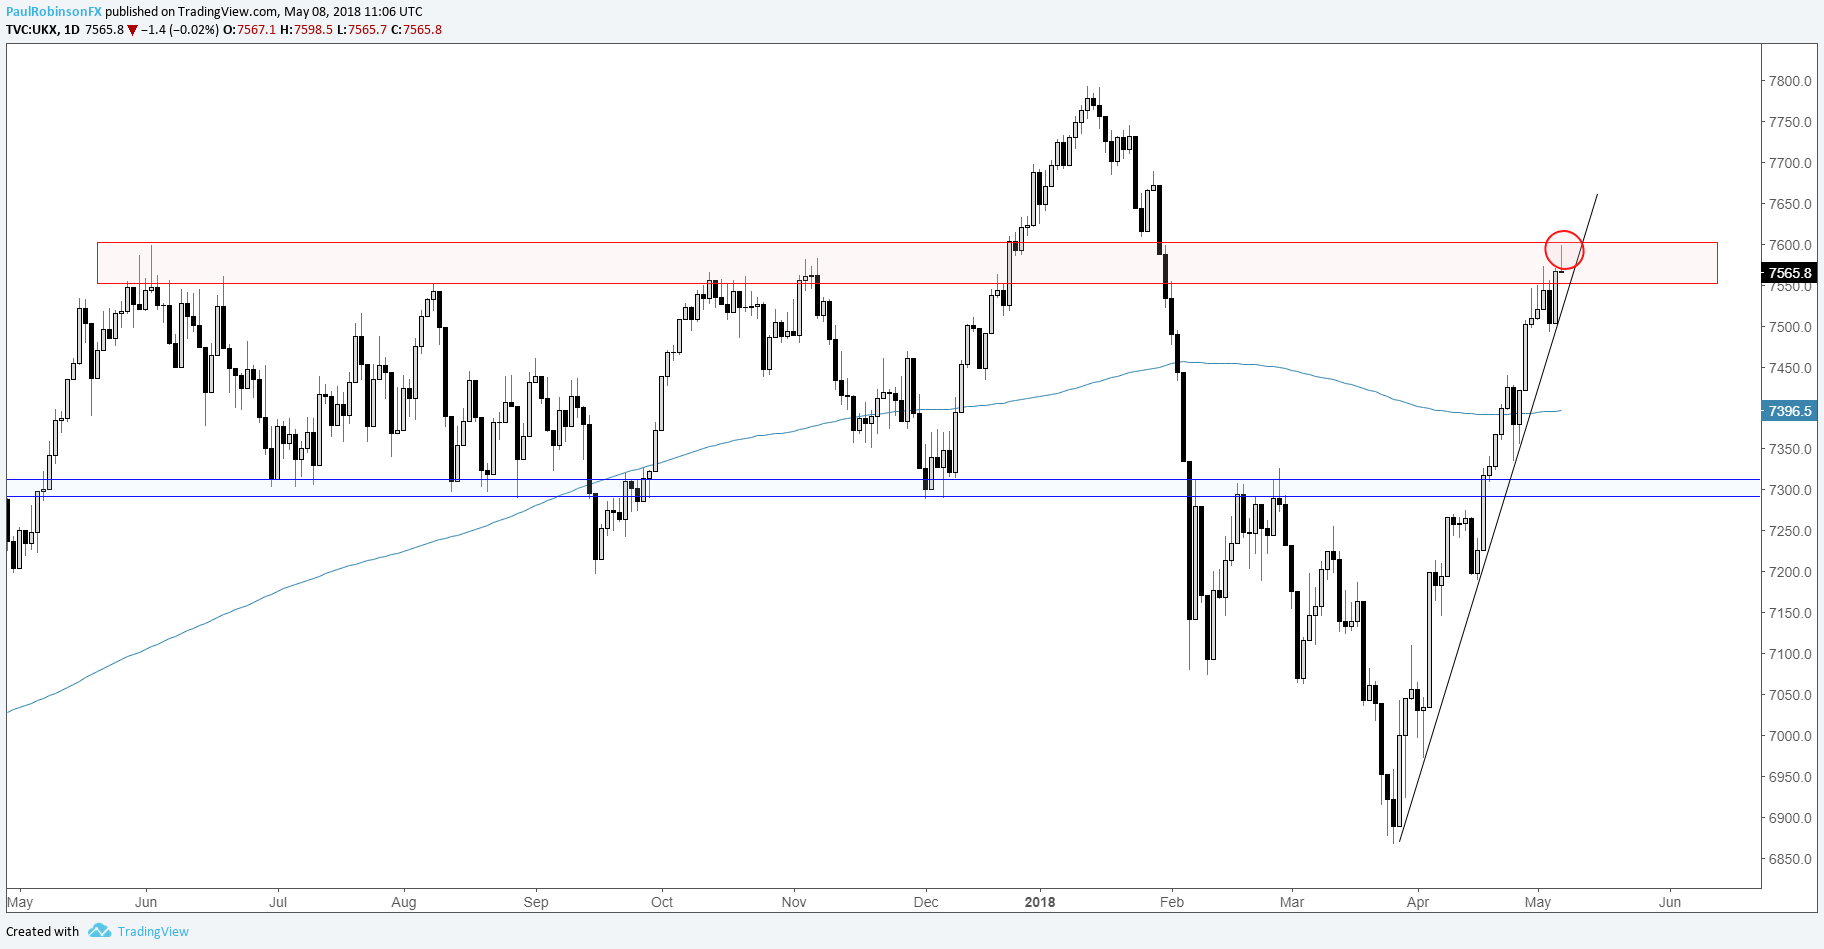
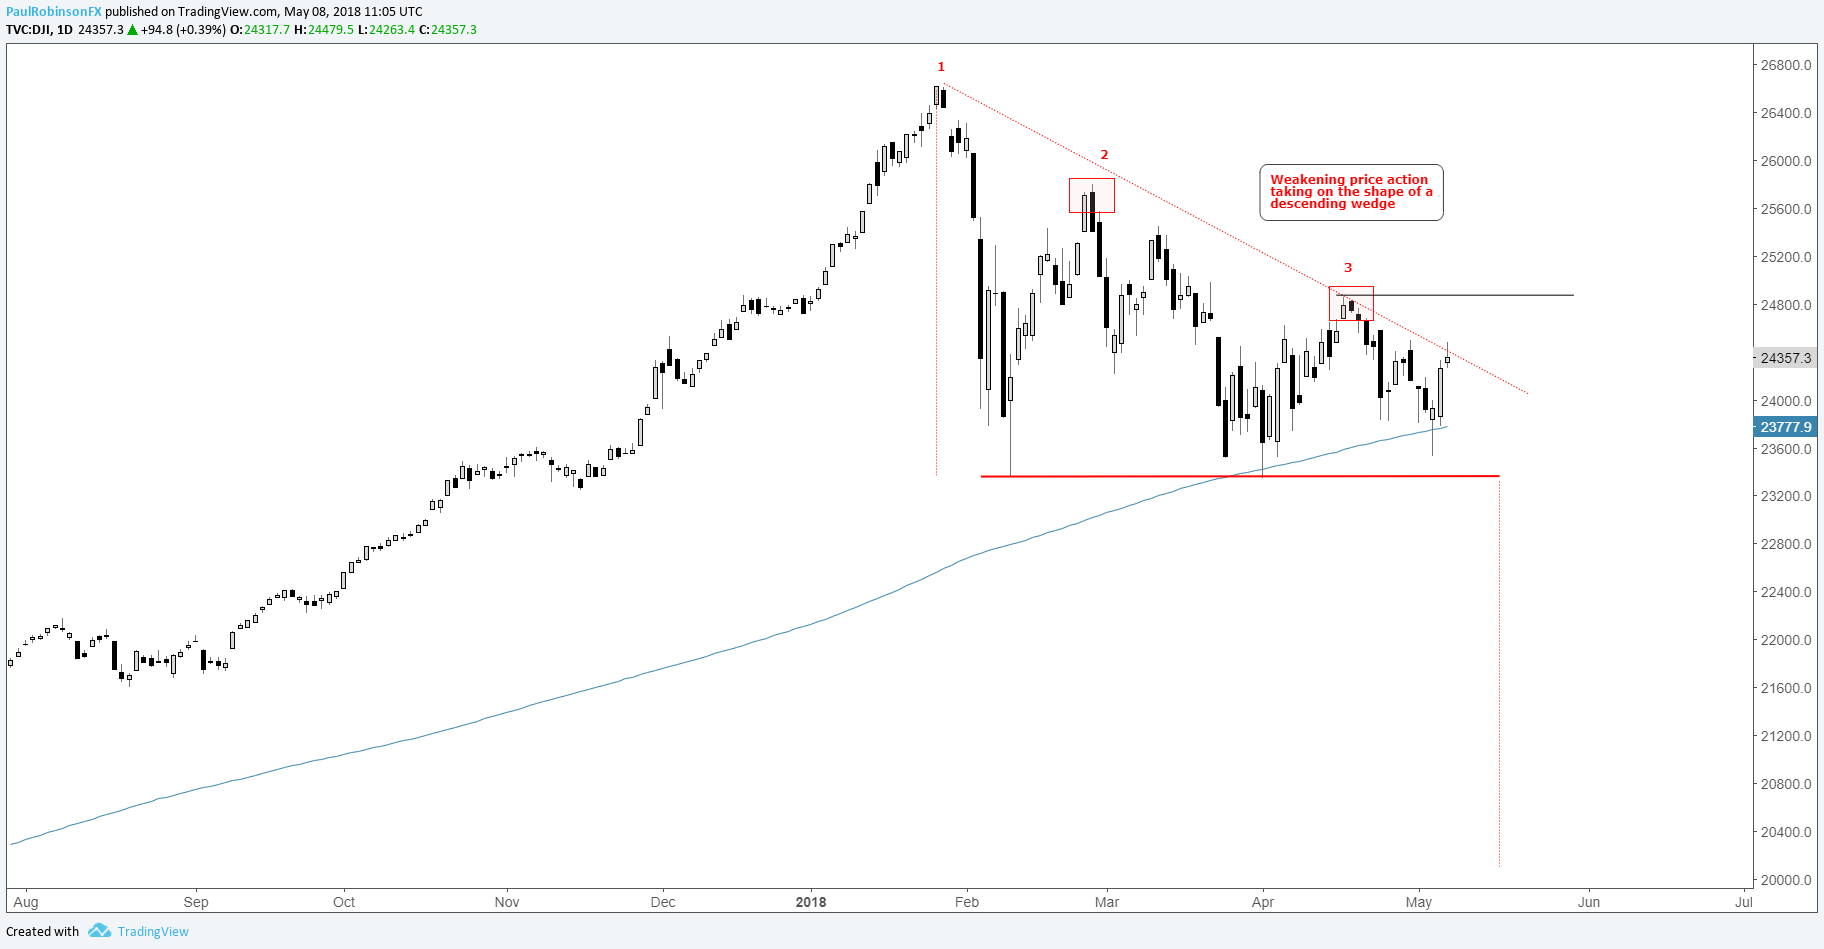
DAX, FTSE at resistance; Dow descending wedge still in play
The DAX is up against a pretty strong area of resistance and currently turning lower. The DAX and euro has a one-month negative correlation of -82%, which is putting a bid in Euro-zone equities as risk appetite has been relatively flat, globally. As we discussed today, correlations can change, but it’s certainly worth noting from a risk management perspective if trading both the DAX and EUR/USD. There is a big picture possibility the DAX is putting in a large top via a head-and-shoulders pattern. It will take some time, though, before this scenario can be validated.
DAX Daily Chart
The FTSE is up against a pretty big spot of resistance and given the extended run it appears to be overbought at the moment. Looking for a turn down here to take shape, how that plays out (strong momentum or gradual pullback), will determine if it’s just a pullback or the beginning of a larger decline. As is the case with the DAX & euro, the FTSE and pound have a strong inverse relationship. The current one-month correlation is an extremely strong -97%, meaning the currency and stock index are trading at almost 1-to-1 in opposite directions.
FTSE Daily Chart
The Dow is still working its way towards fully forming a descending wedge top. If it is to happen, then preferably it turns down now. At the highest the Dow can rise before the topping scenario comes under fire is the 3rd peak (2nd lower-high) situated at 24859. A breakdown below the 200-day MA and lows just under 24k will have the top in full-swing towards a sizable sell-off.
Dow Daily Chart
For the intermediate-term fundamental/technical outlook, check out the Q2 Forecast for Global Equity Indices
Resources for Index & Commodity Traders
Whether you are a new or an experienced trader, DailyFX has several resources available to help you; indicator for tracking trader sentiment, quarterly trading forecasts, analytical and educational webinars held daily, trading guides to help you improve trading performance, and one specifically for those who are new to forex.
---Written by Paul Robinson, Market Analyst
To receive Paul’s analysis directly via email – SIGN UP HERE
You can follow Paul on Twitter at @PaulRobinsonFX


