


US Dollar found strength last week and this trend has more room to grow. EURUSD and USDJPY Elliott Wave patterns imply continued USD strength.
The video above is a recording of a US Opening Bell webinar from April 30, 2018.
Elliott Wave Analysis for EURUSD
For several weeks, we have been arguing that the range in EURUSD may break to the downside. It appears the three-year bullish pattern in EURUSD ended in February 2018 and that the next several months may lead to downward trade.
Carrying a small short position into last week, a big development occurred when EURUSD sentiment closed positive for the first time since April 2017, which is a bearish signal. Therefore, we were waiting to add to the position with a break lower at 1.2153 that triggered on April 26.
It is possible a bounce may develop back to 1.2180-1.2280, but the trend is now firmly planted lower. We look to ride the trend to lower levels possibly as far as 1.12. Bearish patterns remain while the EURUSD chart remains below 1.2414.

EURUSD Sentiment Analysis
EURUSD sentiment continues to hover near parity as it oscillates back and forth between -1.1 and +1.1. A material move above +1.1 would be a bearish signal and hint at further losses for EURUSD.
Notice the orange trend channel on the EURUSD chart above. A move above the trend channel would be normal at this point and nothing to be alarmed about. Strong trends need to consolidate from time to time. Keep an eye on 1.2180-1.2280 for resistance should the orange channel break. To the downside, we are not anticipating any strong rebound until a visit near 1.17. Of course, the Elliott Wave pattern may evolve into something else, but for the time being we are looking towards lower levels.
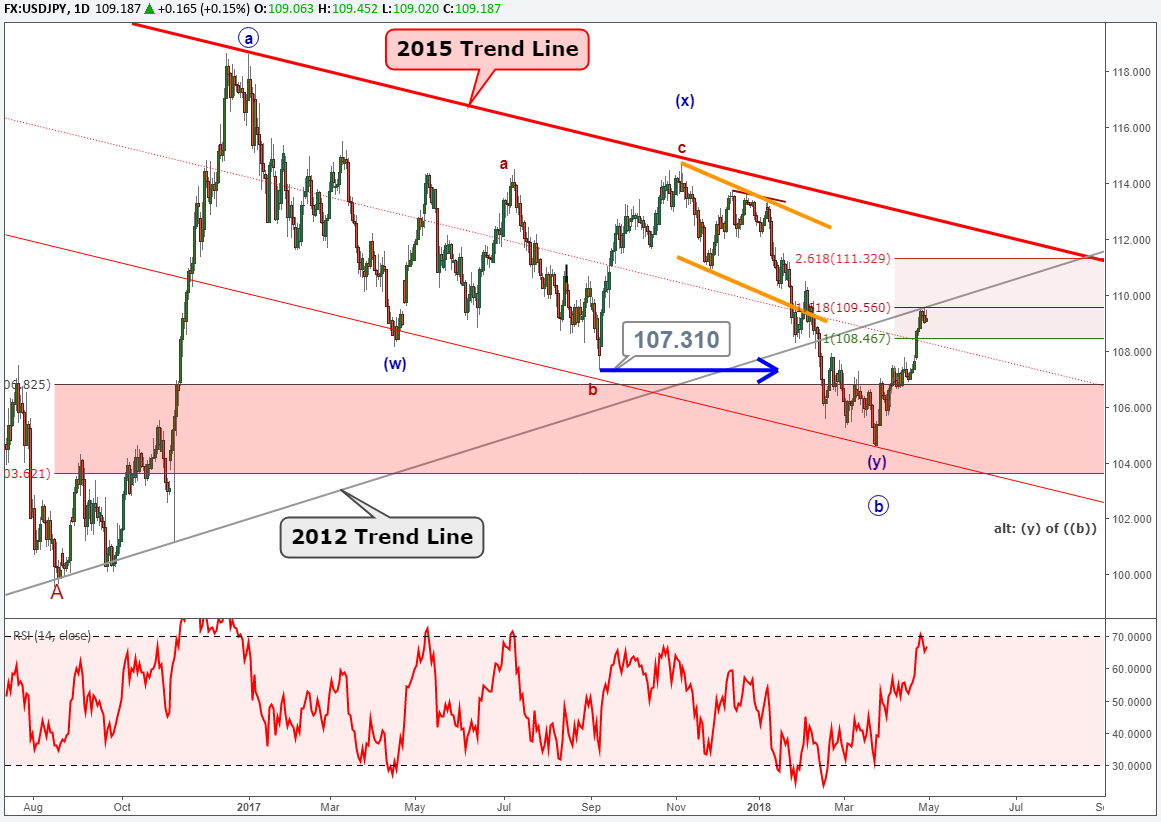
USDJPY Elliott Wave Chart
USDJPY has started a new trend on March 25 with an impulse wave. According to Elliott Wave Theory, this pattern appears incomplete to the upside and may ultimately test 118. The USDJPY chart is running into some resistance as a 2012 trend line crosses near the current price zone. Our preferred Elliott Wave count is that USDJPY may eventually find the strength to persevere higher. However, if this grey trend line holds and if USDJPY falls below 107.46, we are prepared to adopt a wave count that this may be only wave ‘b’ of (y).
Elliott Wave Theory FAQs
What are Elliott Wave impulse waves?
According to Elliott Wave Theory, the market moves five waves in the direction of the near term trend followed by a three wave counter trend wave. An impulse wave is one of two types of motive waves that denotes trend direction. Therefore, if we see a bearish impulse waveform, then after a three-wave counter trend wave, we can anticipate at least one more bearish motive wave.
For those Elliott Wave technicians looking for further study, read about our expert tips in our beginners and advanced trading guides.
After reviewing the guides above, be sure to follow future Elliott Wave articles to see Elliott Wave Theory in action.
What is the biggest mistake forex trader make?
Regardless of the style of analysis, many traders do lose money because they do not take the time to study the market and the effect of leverage. At DailyFX, we have studied millions of live trades and boiled our study down into a Traits of Successful Traders guide. You will find how leverage and human nature affects our trading so you can be better prepared for the next correction.
Elliott Wave Theory can be applied to a variety of highly liquid markets. FX is one of my favorite markets to apply the Elliott Wave principle. Learn more about trading FX with this guide specifically designed for you.
---Written by Jeremy Wagner, CEWA-M
Jeremy Wagner is a Certified Elliott Wave Analyst with a Master’s designation. Jeremy provides Elliott Wave analysis on key markets as well as Elliott Wave educational resources. Read more of Jeremy’s Elliott Wave reports via his bio page.
Communicate with Jeremy and have your shout below by posting in the comments area. Feel free to include your Elliott Wave count as well.
Discuss these markets with Jeremy in Monday’s US Opening Bell webinar.
Follow me on Twitter at @JWagnerFXTrader .
To receive additional articles from Jeremy via email, join Jeremy’s distribution list.


