


The US Dollar Index (DXY) is finally resolving the brutal trading range it was stuck in and has EUR, GBP, NZD, and others all under pressure. The U.S. stock indices are on the verge of validating nasty-looking topping patterns.
Technical Highlights:
- US Dollar Index (DXY) breaking out
- EUR/USD, GBP/USD headed lower
- Kiwi headed lower across the board, GBP/NZD in focus
- U.S. stock markets look near completing a top
For in-depth fundamental and technical analysis for your favorite market or currency, check out the recently released DailyFX Q2 Forecasts.
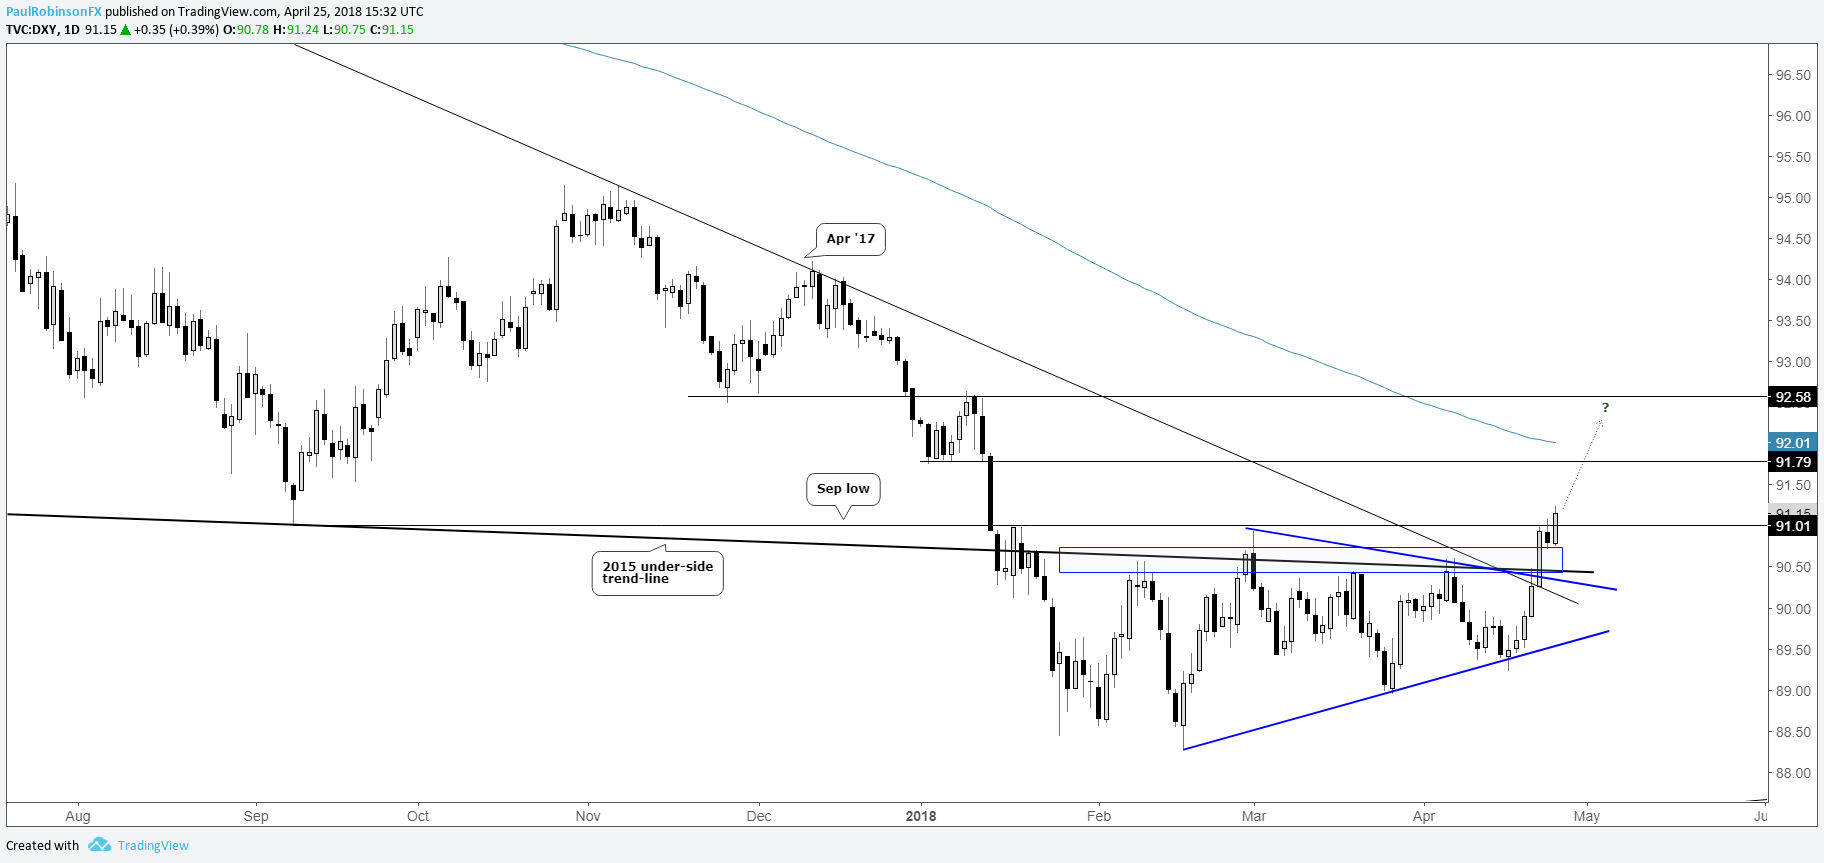
US Dollar Index (DXY) breaking out
The US Dollar Index (DXY) is on the verge of breaking its final hurdle before having room to room. To start the week, the triangle was broken to the top-side through the 2015 slope, April trend-line, and is in the process of taking out the September low. The key will be for today to close above that low, but with other obstacles already cleared, even if it doesn’t it looks like only a function of time.
US Dollar Index (DXY) Daily Chart (Breaking out)
For the intermediate-term fundamental/technical outlook, check out the Q2 Forecast for USD
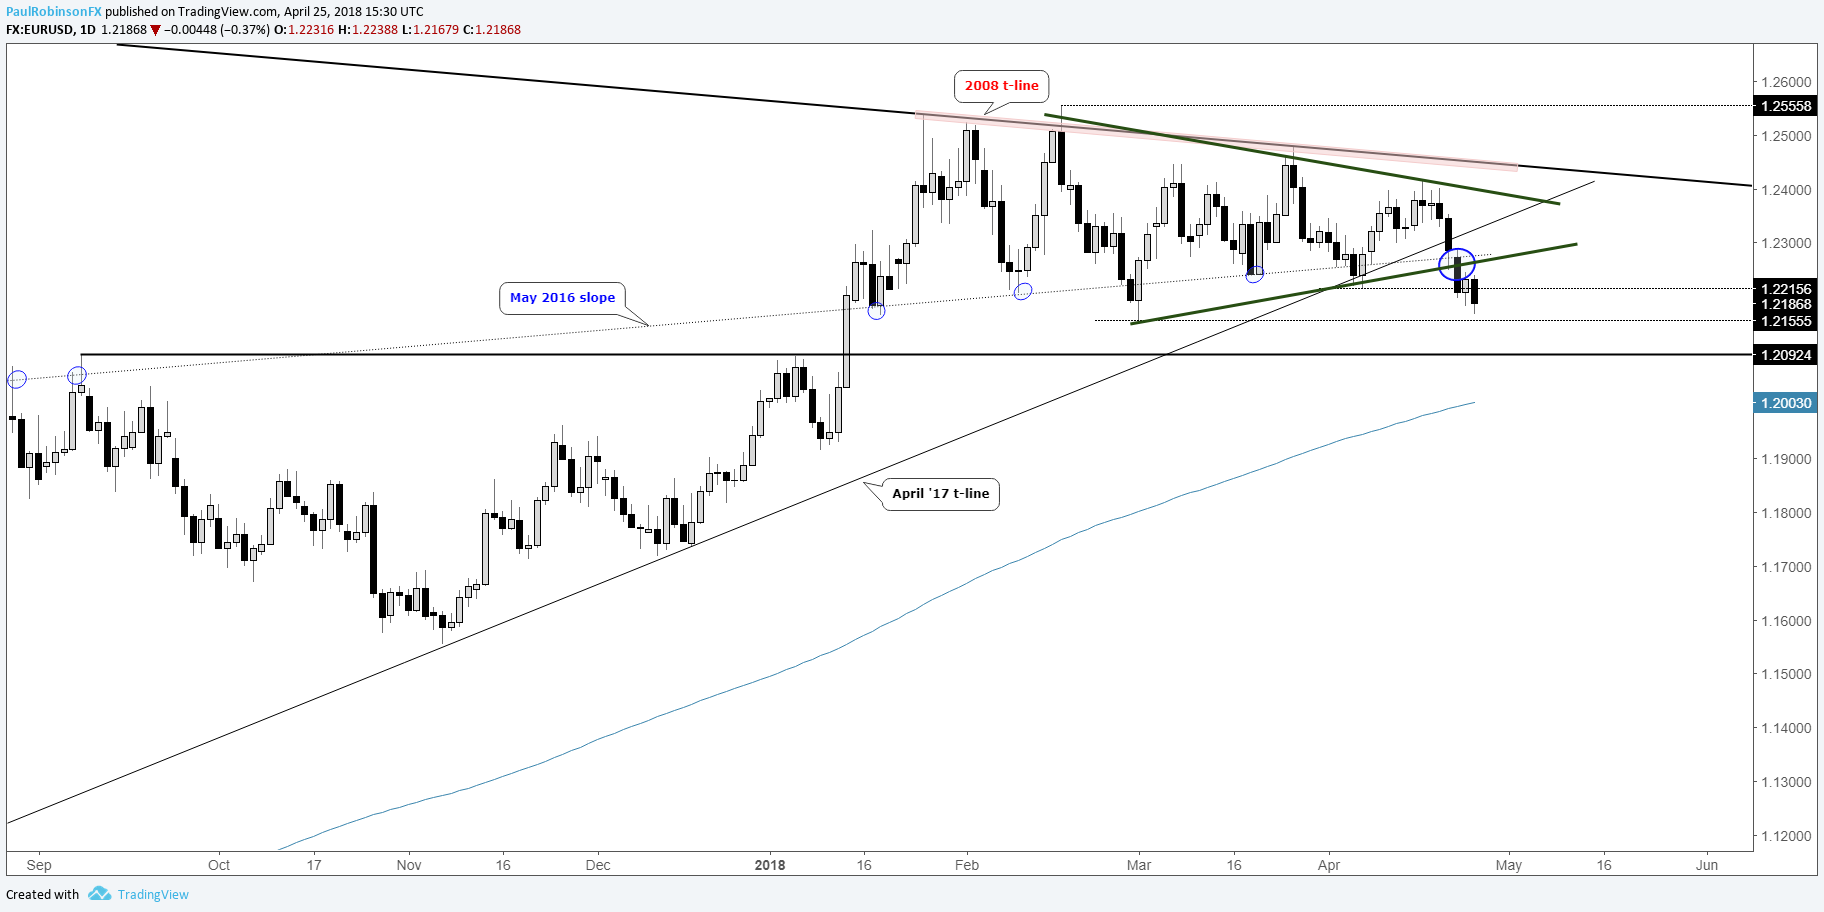
EUR/USD, GBP/USD headed lower
As the main driver of DXY (~57% weighting), EUR/USD is heading in reverse, taking out support levels. The April 2017 trend-line and triangle have been broken along with an earlier-month swing-low. Next up is 12155 followed by the important 2017 high at 12092. Given that large speculators in the futures market are enormously long, holding 151k contracts, should we continue to see support levels falter this group of trend-followers could start heading for the exit in earnest, causing price to accelerate lower.
EUR/USD Daily Chart (Falling from Triangle)
Last week, we viewed GBP/USD as a potential buy off the November trend-line, but with no buyers showing up and the line cleanly broken, focus has shifted lower towards a trend-line dating back to March of last year and price support from March. Not only was the November trend-line broken, but a lower low from earlier this month created, bolstering a bearish bias. Rallies are viewed as potential shorting opportunities.
GBP/USD Daily Chart (Room to decline)

For the intermediate-term fundamental/technical outlook, check out the Q2 Forecast for EUR & GBP
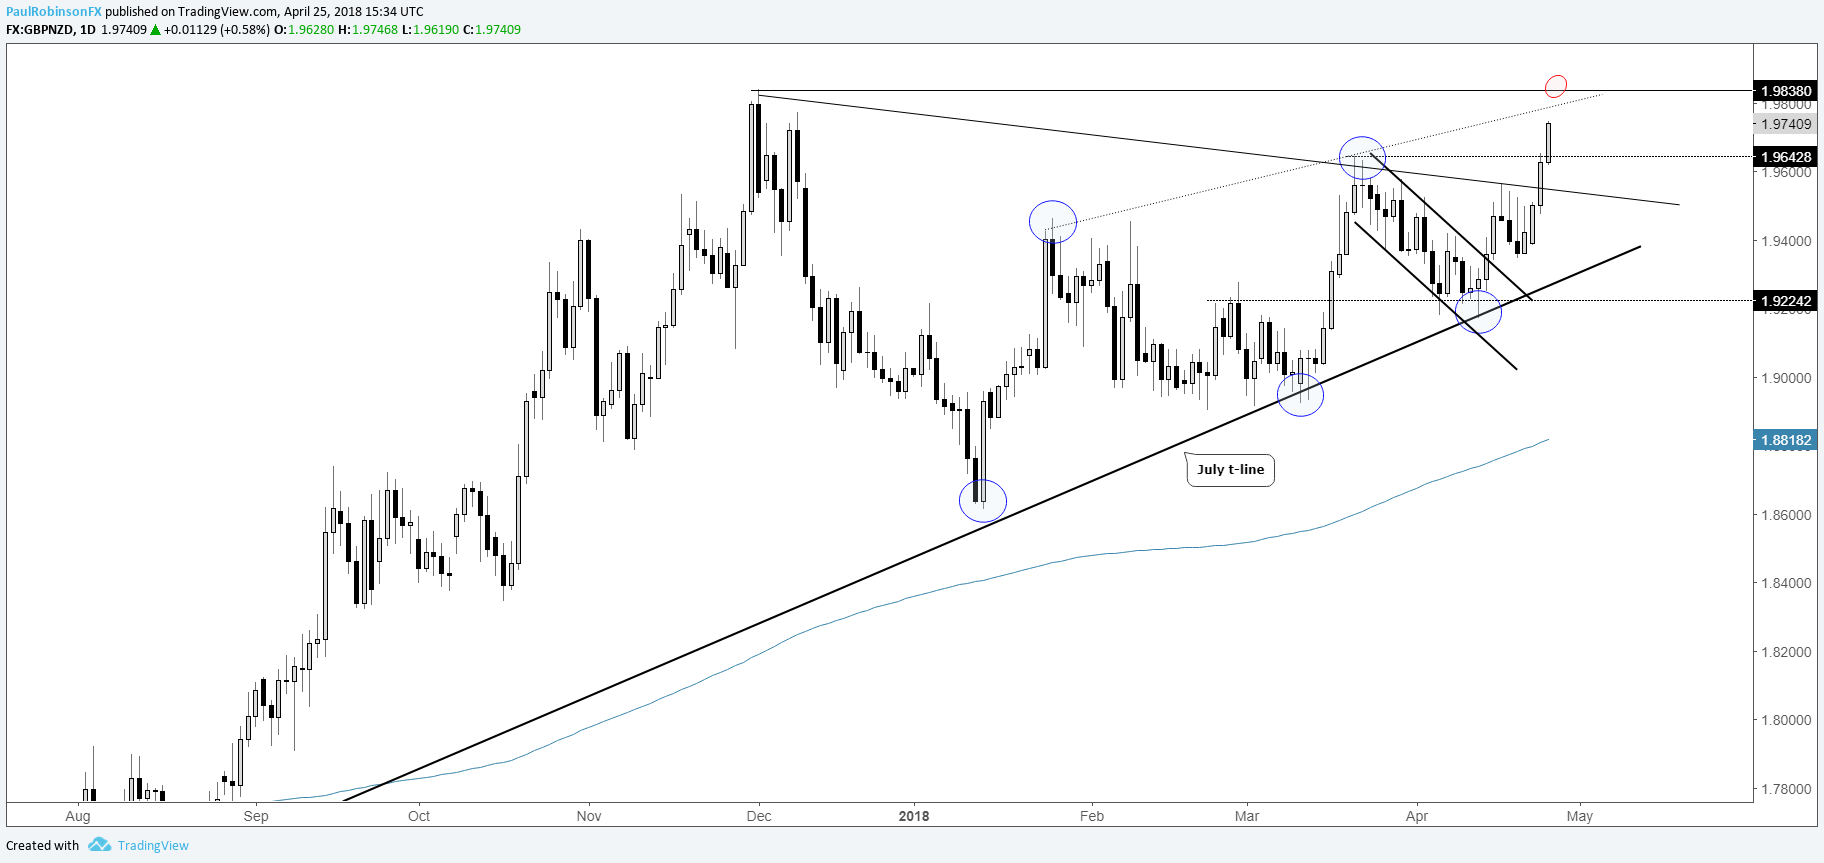
Kiwi headed lower across the board, GBP/NZD in focus
Kiwi continues to remain very weak across the board. The GBP/NZD trade we highlighted a couple of weeks back remains in full swing, with the first target having been met around 19640. Next up is the December 1 high at 19838. On approach, the strategy on this end is to give it room to see if it can break out to new highs, extending the trade further.
GBP/NZD Daily Chart
In FX, we also looked at USD/JPY, AUD/USD, NZD/USD, EUR/JPY, GBP/JPY, NZD/JPY, along with a few others…
U.S. stock markets look near completing a top
The U.S. stock market looks to be on the cusp of a significant decline, with topping patterns in the major indices nearing maturity. The Dow is carving out a descending wedge-like pattern, while the S&P 500 is doing similar, and the Nasdaq 100 is posting a head-and-shoulders top.
Should the Dow break the bottom of the pattern in the 23300s, the measured move target is all the way down around the 20k mark. For those focusing on FX, if equity markets take a spill of that size it is very likely we see a material uptick in volatility across all asset classes. The U.S. dollar breaking out is supportive of this notion.
Dow Daily Chart (Weakening)

For the intermediate-term fundamental/technical outlook, check out the Q2 Forecast for Equity Markets
Resources for Index & Commodity Traders
Whether you are a new or an experienced trader, DailyFX has several resources available to help you; indicator for tracking trader sentiment, quarterly trading forecasts, analytical and educational webinars held daily, trading guides to help you improve trading performance, and one specifically for those who are new to forex.
---Written by Paul Robinson, Market Analyst
To receive Paul’s analysis directly via email – SIGN UP HERE
You can follow Paul on Twitter at @PaulRobinsonFX


