Today, we focused on the ongoing range in gold, with it likely to sink back towards the bottom of the range with the US dollar on the verge of accelerating higher. U.S. equity indices still look to be topping with near-term price action choppy. The DAX has resistance to contend with just ahead...
Technical Highlights:
- Gold looks headed back to bottom of range on USD strength
- U.S indices lack clarity short-term, topping potential remains
- DAX has levels to contend with just ahead
For in-depth fundamental and technical analysis for your favorite market or currency, check the DailyFX Q2 Forecasts.
Gold looks headed back to bottom of range on USD strength
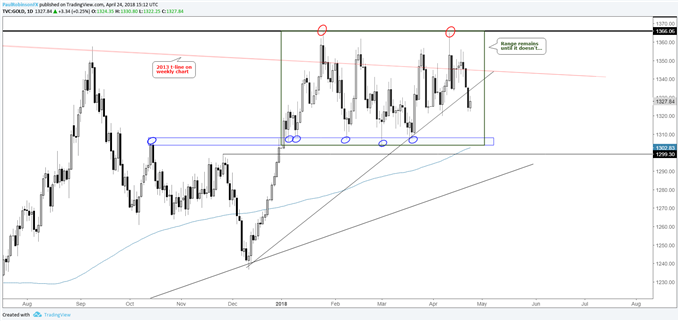
Gold remains broadly stuck in the same range that has been place since January and has been a difficult handle while trading in the middle of the price zone from near 1300 up into the 1360s. Nevertheless, gold looks poised to trade towards the bottom the range thanks to USD.
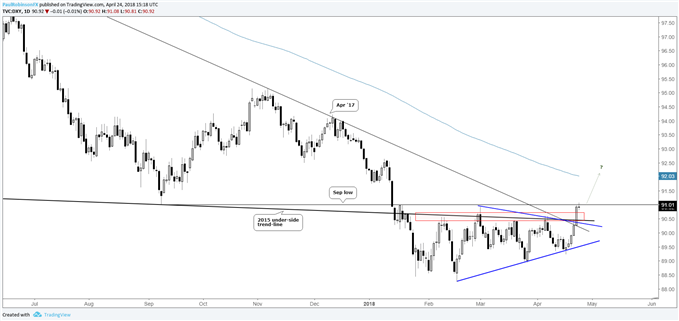
The U.S. Dollar Index (DXY) is on the verge of breaking all key resistance levels. Yesterday, the DXY broke out of a triangle formation, above the 2015 slope, April 2017 trend-line, and only needs to cross above the September low before finding itself trading into ‘open space’.
Barring a reversal and breakdown back through the underside of the triangle, pressure should continue to remain on gold. Should it reach down towards 1300 we’ll be paying attention to whether it can hold or wants to finally break the range. The short-term path of least resistance is lower, but traders should take care with it still stuck in the middle of the range.
Gold Daily Chart (Low-end of range could soon be tested)
US Dollar Index (DXY) Daily Chart (Ready to Rip?)
For the intermediate-term fundamental/technical outlook, check out the Q2 Forecast for Gold and US Dollar
U.S indices lack clarity short-term, topping potential remains
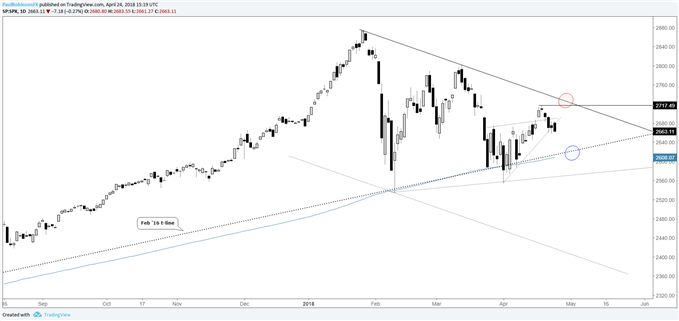
The S&P 500 remains a bit of a muddled picture in the short-term, but eyes remain focused on whether it can test the trend-line off the record highs and turn back down to cement another lower high. It may have already done so in recent days. If a turn has been already put in place, the all-important 200-day and Feb 2016 trend-line weigh in as a major big-picture 'line-in-the-sand' for both sides of the tape.
S&P 500 Daily Chart (Watch the top-side t-line)
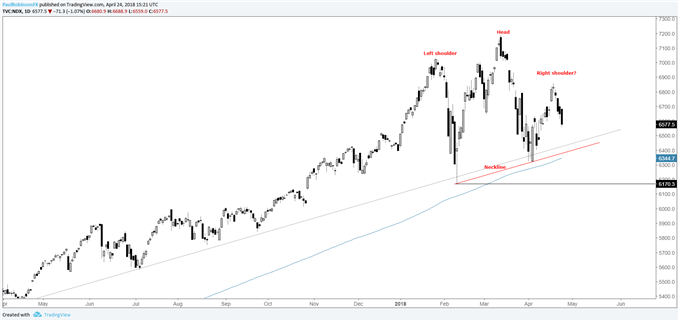
The Nasdaq 100 is showing potential for a head-and-shoulders top, but will need to first carve out a right shoulder and trade below the would-be neckline around 6380. If a turn back higher doesn’t soon develop that could become the case relatively quickly.
For the intermediate-term fundamental/technical outlook, check out the Q2 Forecast for Equity Indices
Nasdaq 100 Daily Chart (Head-and-shoulders potential)
DAX has levels just ahead to contend with
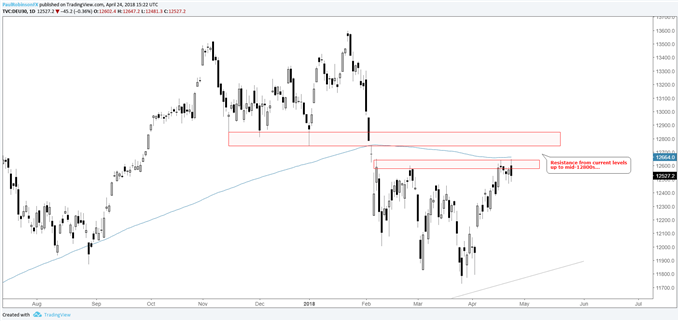
The DAX is currently struggling around resistance, and since the webinar this morning it is posting a somewhat bearish day. Even if the DAX can continue higher, it has the 200-day MA followed by the area between 12745 into the mid-12800s. We also discussed the possibility of a major topping formation in the form of a head-and-shoulders dating back to June, but we’ll need more time before we can commit to it.
For now, it will be viewed as only a pullback given the broader bullish trend with the Feb trend-line as a possible target on a deep retracement. Large swings with limited progress has been oil’s path the past few months, so that would be in line with how its been ‘behaving’ even if it is to continue to new heights.
DAX Daily Chart (Resistance ahead)
Resources for Index & Commodity Traders
Whether you are a new or an experienced trader, DailyFX has several resources available to help you; indicator for tracking trader sentiment, quarterly trading forecasts, analytical and educational webinars held daily, trading guides to help you improve trading performance, and one specifically for those who are new to forex.
---Written by Paul Robinson, Market Analyst
To receive Paul’s analysis directly via email – SIGN UP HERE
You can follow Paul on Twitter at @PaulRobinsonFX


