


In this webinar, we used price action to look at macro markets after yesterday’s one-year high print in US inflation numbers. While USD-strength was noticeably missing around that release, it started to show up later in the day, and DXY soon posted a bounce towards the 90.00 level, at which point strength faltered again. This keeps a bearish bias around the Greenback as we move towards the close of this week, and in this webinar we looked at setups on both sides of the US Dollar.
Talking Points:
- If you’re looking to improve your trading approach, our Traits of Successful Traders research could help. This is based on research derived from actual results from real traders, and this is available to any trader completely free-of-charge.
- DailyFX Quarterly Forecasts have been updated for Q2, and they’re available directly from the following link: DailyFX Trading Guides/Quarterly Forecasts.
If you’d like to sign up for our webinars, we host an hour-long event on Tuesday and Thursday, each of which can be accessed from the below links:
Tuesday: Tuesday, 1PM ET
Thursday: Thursday 1PM ET
To receive James Stanley’s Analysis directly via email, please sign up here.
US Dollar Holds Support, Finds Sellers at Resistance
The support zone that we looked at in the US Dollar on Tuesday has held, and price action has made a topside advance to find a bit of resistance underneath the 90.00 level on DXY. We looked at this resistance zone earlier this morning, and prices remaining below the 90.00 level keeps the door open for short-side continuation in the Greenback. In this webinar, we looked at four long-USD scenarios and three on the short-side amongst the majors.
US Dollar Hourly Chart: Reversal After Resistance Test

Chart prepared by James Stanley
EUR/USD Bounces From 1.2300 After Weidmann Speech
Longer-term, the bullish trend in EUR/USD remains attractive. But, for most of 2018, that trend has been on hold as price action in EUR/USD has been range bound. After bulls shied away from 1.2500 in January and then again in February, prices in EUR/USD have been back-and-forth, and we’ve looked at a variety of support levels to work the range with a prior trend-side bias. We looked at support last week around 1.2237, and then again this morning around 1.2300. Price action has since made a leap up to the key zone that runs from 1.2335-1.2350, and as I shared, this could actually open the door for short-term bearish sets. I’m retaining a bullish view, so I’m looking for that move to push prices down to 1.2300, at which point I can investigate viability of bullish trend continuation.
EUR/USD Hourly: 1.2300 Holds, But Bulls Get Shy at 1.2335-1.2350

Chart prepared by James Stanley
USD/CHF as a More Attractive Long USD Option
On Tuesday, I looked at USD/CHF as a potential bull trap, and I had shared what I wanted to see for the door to open to topside. That criteria has been met as prices have re-scaled the Fibonacci level at .9583, and at this point, the door is open to bullish continuation in the pair, looking for a re-test of the high at .9650.
USD/CHF Eight-Hour Chart: Bullish Continuation Possibilities

Chart prepared by James Stanley
GBP/USD Bulls Calm After Print of Fresh Two-Month Highs
We’ve been following the long side of GBP/USD as one of the more attractive options for USD-weakness, and that setup has continued to show promise as price action volleyed up to a fresh high this morning. We looked at another potential support level earlier in the week at 1.4145, and after a quick test there, prices caught a bid to run up to that fresh high. At this stage, aggressive longs could be sought at 1.4200, and if that can’t hold, support above the prior swing of 1.4145 keeps the door open for topside in the pair.
GBP/USD Four-Hour Chart

Chart prepared by James Stanley
AUD/USD: Two Days of Indecision in Resistance Zone
We’ve been following an area for potential lower-high resistance in AUD/USD, and that range of prices runs from .7750-.7780. Prices ran into this zone on Tuesday, and Wednesday produced a spinning top on the daily chart, with today’s candle looking as though it may close as the same. This is not yet confirmed, as we remain an hour or so away from the close of US trade; but should we get a second consecutive day of indecision, the door is opened for short-side setups with stops above the prior swing around .7986.
AUD/USD Daily Chart: Indecision Within Resistance Zone

Chart prepared by James Stanley
NZD/USD: Bullish Price Action Drives Deeper into Resistance
We’ve been following an area of resistance in NZD/USD that starts with the level at .7735. This is the 38.2% retracement of the 2009-2011 major move, and this area has had a fairly large pull on the range in the pair that’s been present for the past 18 months. But – near-term price action remains bullish, and this keeps the short-side at bay, at least for now. More interesting at this point is the level at .7434. We had a double top print there from January/February price action, and this level had also given a fairly strong reversal in September of this year. If that breaks – the door is opened for topside up to the .7500 psychological level. If bulls falter ahead of that price, the short-side of NZD/USD remains as interesting, but near-term price action would first need to point-lower before the door opens for bearish setups in the pair.
NZD/USD Weekly Chart: Bullish Near-Term as Prices Within Resistance – Watch .7434
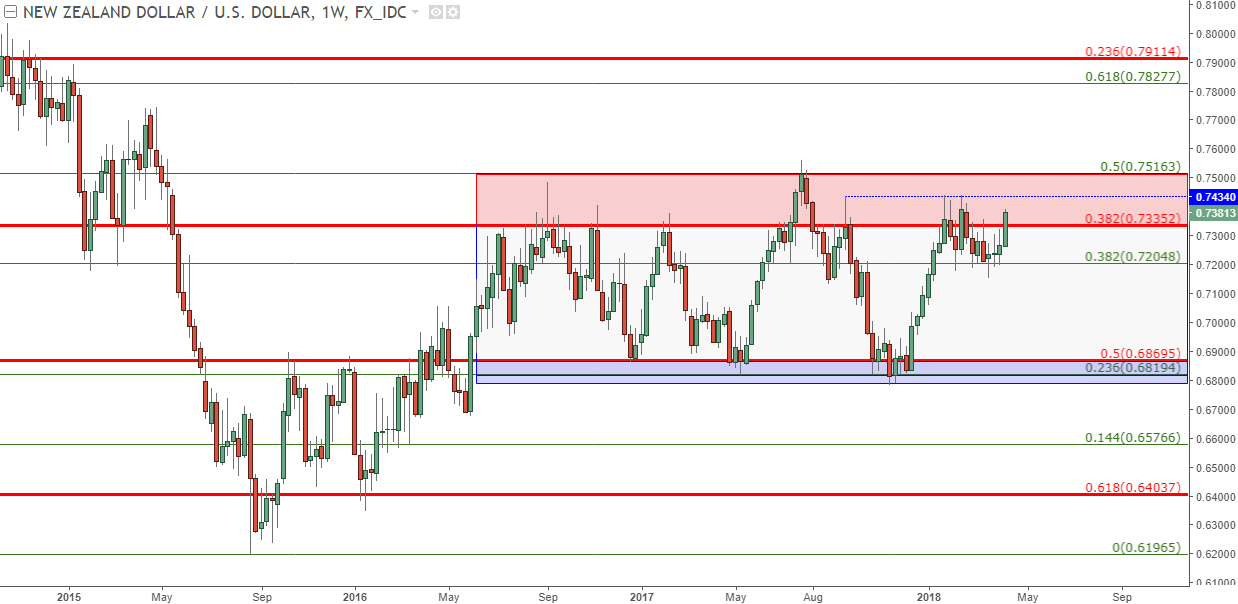
Chart prepared by James Stanley
USD/CAD Bearish Continuation Potential
We had come into this week looking at a key area of potential support in USD/CAD. That area was slammed through on Monday when the pair broke down to fresh lows, and we’ve since seen a continuation of that run. At this point, short-term charts are indicative oversold conditions, and this brings a bit of caution to chasing the move at this point. But – that prior area of support can be re-purposed as resistance as we move into next week, and there is a Bank of Canada rate decision on the calendar, so there remains plenty of motivation for continued volatility in USD/CAD.
USD/CAD Hourly Chart: Down-Trend Long in the Tooth?

Chart prepared by James Stanley
USD/JPY Bullish Continuation Potential
USD/JPY put in a breakout in March after the year opened with some considerable Yen-strength. That theme of Yen-strength started to see turbulence as we turned the page into Q2, and in the first couple of weeks of the quarter USD/JPY continues to carry bullish potential. We had looked into a set of building lower-highs last week, and that has helped to push prices up to another high water-mark around 107.50. Since that high, we’ve seen a build of resistance around that level, but bulls haven’t shown signs of yet throwing in the towel, as we’ve seen a build of support atop a prior zone of resistance. This keeps the door open for topside, with the primary point of attraction being the prospect of Yen-weakness continuing. We looked at two additional setups that could be more attractive for that same theme in EUR/JPY and GBP/JPY.
USD/JPY Four-Hour Chart

Chart prepared by James Stanley
EUR/JPY Climbs Back-Above Key Zone
The area that runs from 131.43-132.05 was a big zone of support in the latter-portion of 2017, and when prices reversed in February, this area gave a considerable amount of support before sellers were finally able to push prices below. And after that – the prior area of support gave multiple instances of resistance, indicating potential for short-side continuation. But as Yen-weakness has come back, bulls have pushed prices back above this area on the chart, and we’re now seeing support show up back in that prior support/resistance area, indicating that bullish continuation may be on the cards. We looked into this setup yesterday in the article, EUR/JPY: Bullish Potential as Prices Climb Above Key Fibonacci Level.
EUR/JPY Daily Chart

Chart prepared by James Stanley
GBP/JPY to Fresh Two-Month Highs
Also on the Yen-reversal front we have what’s been a pretty exciting setup in GBP/JPY. We looked at support earlier in the week around the 150.80 level after prices had found a bit of resistance at the Fibonacci level around 151.39. Once prices broke out to fresh highs, support showed at prior resistance and more new highs were on the way. At this point, the prior area of Fibonacci resistance at 152.17 could be used in a similar manner, looking to catch higher-low support in the pair.
GBP/JPY Four-Hour Chart
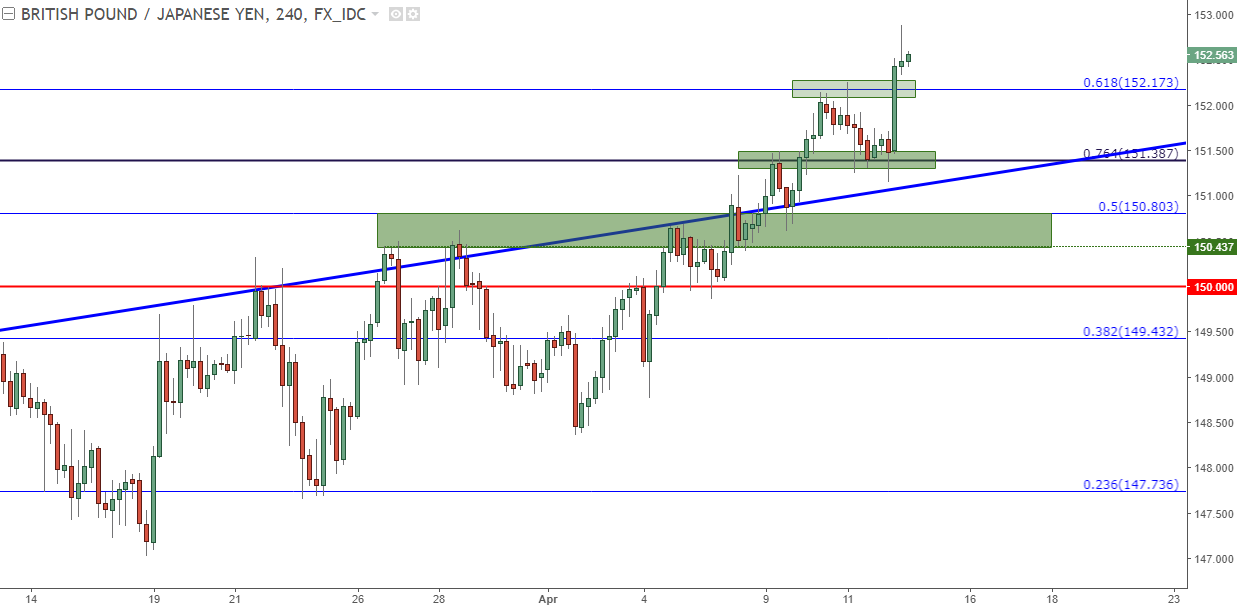
Chart prepared by James Stanley
To read more:
Are you looking for longer-term analysis on Gold prices? Our DailyFX Forecasts for Q1 have a section specifically for Gold. We also offer a plethora of resources on our Gold page, and traders can stay up with near-term positioning via our IG Client Sentiment Indicator.
Forex Trading Resources
DailyFX offers a plethora of tools, indicators and resources to help traders. For those looking for trading ideas, our IG Client Sentiment shows the positioning of retail traders with actual live trades and positions. Our trading guides bring our DailyFX Quarterly Forecasts and our Top Trading Opportunities; and our real-time news feed has intra-day interactions from the DailyFX team. And if you’re looking for real-time analysis, our DailyFX Webinars offer numerous sessions each week in which you can see how and why we’re looking at what we’re looking at.
If you’re looking for educational information, our New to FX guide is there to help new(er) traders while our Traits of Successful Traders research is built to help sharpen the skill set by focusing on risk and trade management.
--- Written by James Stanley, Strategist for DailyFX.com
To receive James Stanley’s analysis directly via email, please SIGN UP HERE
Contact and follow James on Twitter: @JStanleyFX


