


The euro is testing support levels through horizontal price action, could soon have the 2008 trend-line under assault again. Yen-pairs look heavy, a couple are challenging but failing at resistance. Gold readying itself for a move. The DAX has potential to soon decline rapidly.
Technical Highlights:
- EUR/USD testing support via time correction (so far)
- Yen-crosses heavy, not able to rise above resistance levels
- Gold could be nearing range resolution
- Big drop in the DAX could be coming
For in-depth fundamental and technical analysis on your favorite market or currency, check out the newly released DailyFX Q2 Forecasts.
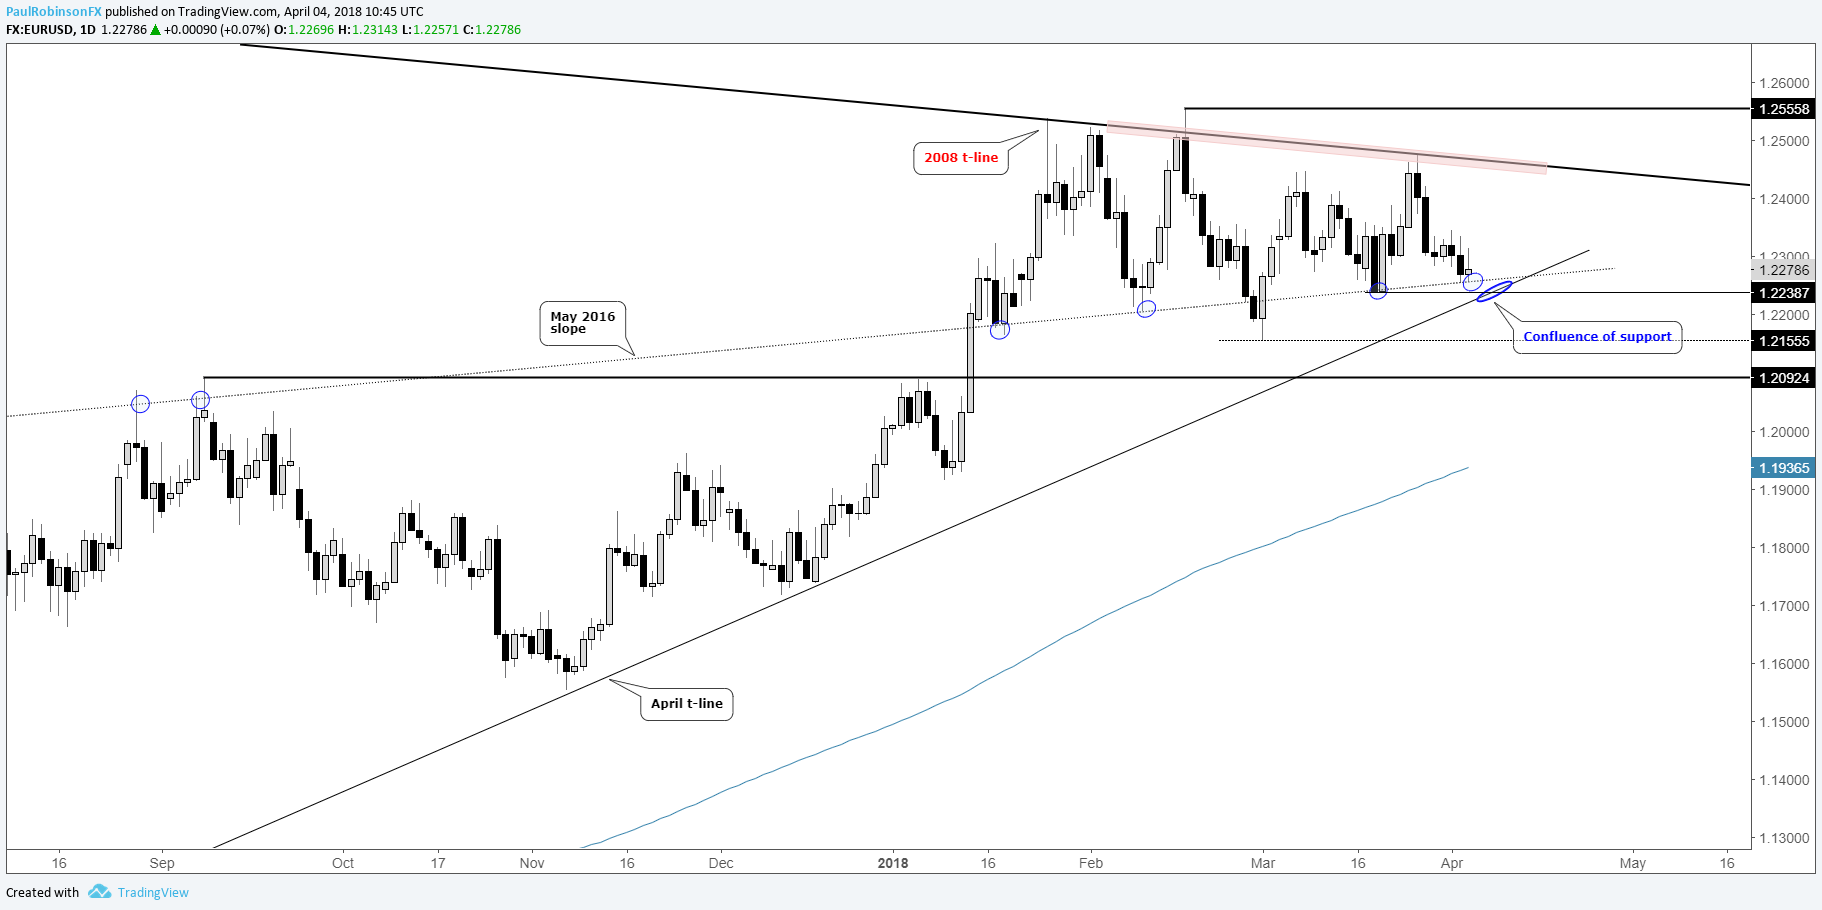
EUR/USD testing support via time correction (so far)
EUR/USD remains a difficult handle with it effectively trading at the same rate it was at back in mid-January. The horizontal price action, or time correction, is bringing into play again the May 2016 slope which has held as support on several occasions thus far this year.
In addition to the May slope, we have the April 2017 trend-line running up along with the March 20 low. The cluster of support makes the area around 12240 an important one to hold on a daily closing basis. A hold and spring back higher could have the 2008 trend-line back in focus, as well as keep the range intact for a potential breakout later on. Should the euro drop below support, though, weakness is likely to set in, but momentum will likely be hard to find until a decline below all support including the 2017 high.
See how current positioning in various markets/FX pairs could signal their next moves on the IG Client Sentiment page.
EUR/USD Daily Chart (Confluence of Support)
Yen-crosses heavy, not able to rise above resistance levels
USD/JPY is turning lower from the top of what is becoming a well-defined channel, with the likelihood growing of a sizable swing lower in-line with equity markets. As long as USD/JPY stays below 107 the outlook remains intact.
USD/JPY Daily Chart (Near top of bearish channel)

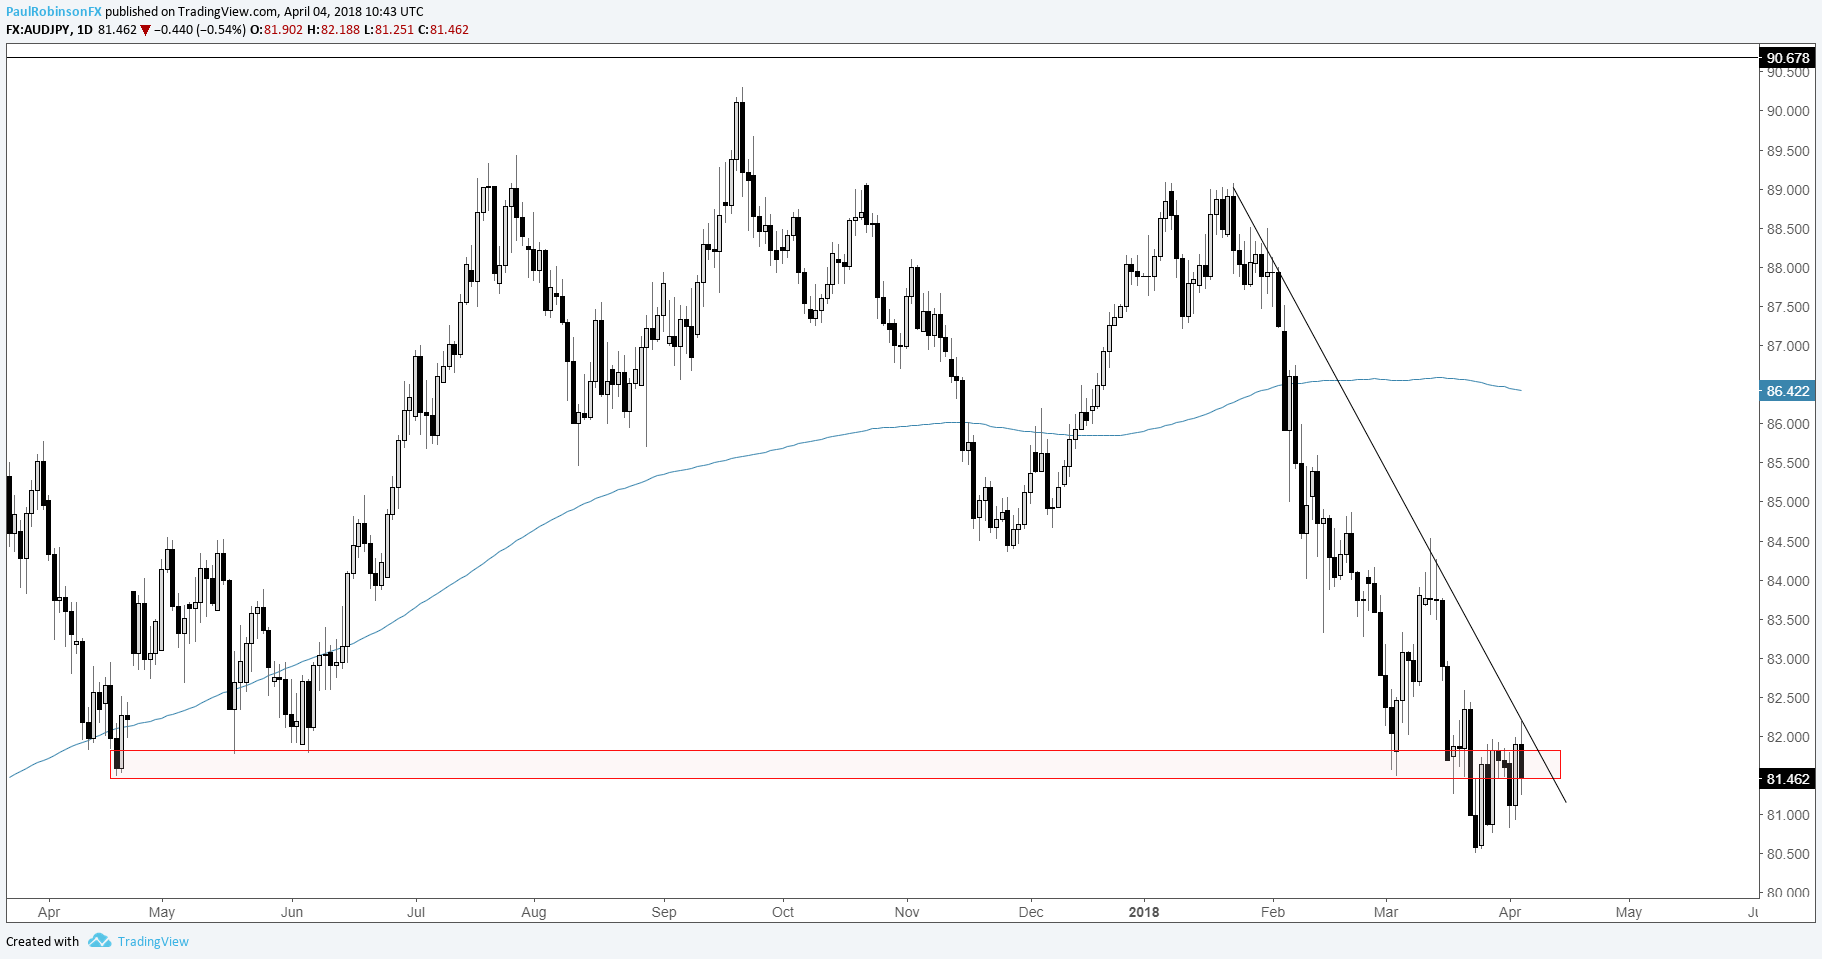
AUD/JPY is turning down from a confluence of resistance via horizontal price levels and a trend-line from January. EUR/JPY is poorly positioned below 13200, with the sequence of lower-lows and lower-highs since last month increasingly the notion we will soon see the cross take a spill as JPY strengthens across the board.
AUD/JPY Daily Chart (turning down from resistance)
In FX, we also looked at GBP/JPY, CHF/JPY, CAD/JPY, NZD/USD, AUD/USD, USD/CAD, AUD/NZD, along with a few others.
For more in-depth analysis, check out the Q2 Forecast for major currencies
Gold could be nearing range resolution
The outlook for gold has been one of avoiding getting caught up over-trading while in its trading range. The 2013 trend-line continues to be a problem on the top-side. Gold could be strengthening within the range and set to breakout soon, but we’ll want to see a weekly close above the 2013 trend-line along with a move above 1366.
Gold Daily Chart (Range break coming?)

For more in-depth analysis, check out the Q2 Forecast for Gold
Big drop in the DAX could be coming
As discussed this morning, the DAX could be working its way towards a major leg lower. The bearish price sequence in the way of a downward sloping channel is poised to lead prices to accelerate lower. Keep an eye on the 200-day MAs in U.S. markets (namely the S&P 500), as it’s considered a big threshold. A big break there will reverberate around the globe.
DAX Daily Chart (Bearish price sequence)

Resources for Index & Commodity Traders
Whether you are a new or an experienced trader, DailyFX has several resources available to help you; indicator for tracking trader sentiment, quarterly trading forecasts, analytical and educational webinars held daily, trading guides to help you improve trading performance, and one specifically for those who are new to forex.
---Written by Paul Robinson, Market Analyst
To receive Paul’s analysis directly via email – SIGN UP HERE
You can follow Paul on Twitter at @PaulRobinsonFX


