


The S&P 500 broke the 200-day and Feb trend-line yesterday, but in unconvincing fashion. However, if it can’t gain traction quickly, then look for the market to accelerate lower. With it, then, will go the DAX and others. Gold best sold on rallies, bought on dips in range. Crude oil, keeping an eye on July slope.
Technical Highlights:
- S&P 500 trading at pivotal spot, DAX in bearish channel
- Gold remains stuck in a range beneath 2013 trend-line
- Crude oil turned of January high, watch the July slope
For in-depth fundamental and technical analysis for your favorite market or currency, check out the newly released DailyFX Q2 Forecasts.
S&P 500 trading at pivotal spot, DAX in bearish channel
The S&P 500 closed below the 200-day MA yesterday for the first time since June 2016, along with a minor break of the trend-line extending higher from February 2016. It wasn’t the most convincing break, but if we don’t see a quick recapture of these lines, then another big leg lower reamins in progress.
First up in terms of support is the Feb spike-day low at 2532, and below there we’ll be looking towards the lower parallel attached to the trend-line running off the record high, currently in the vicinity of the mid-2400s.
S&P 500 Daily Chart (Trading Around 200-day, Feb t-line)

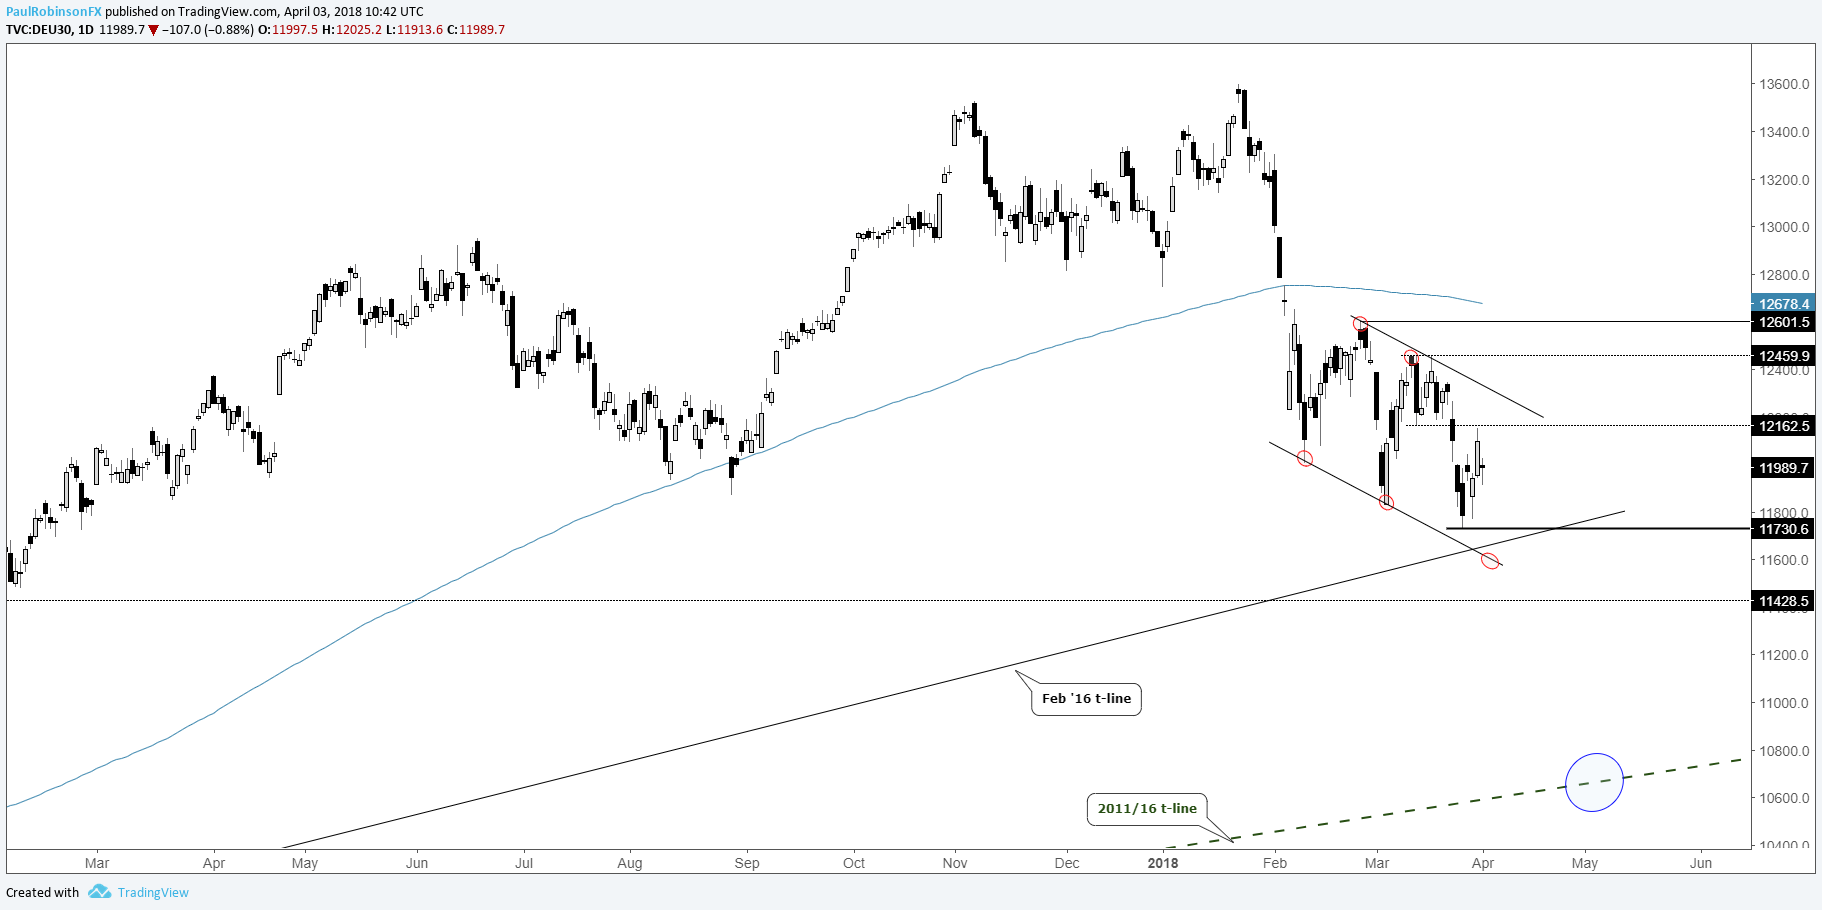
The DAX gapped lower this morning in sympathy with yesterday’s sell-off in the U.S. The German benchmark remains firmly entrenched within the bearish descending channel and is seen at risk of starting another sharp leg lower. The Feb 2016 trend-line arrives as support, but not viewed as likely to hold given poor risk sentiment and technical structuring.
DAX Daily Chart (Bearish Channel)
For more in-depth analysis, check out the Q2 Forecast for the S&P 500 and DAX
Gold remains stuck in a range beneath 2013 trend-line
Gold continues to be a difficult handle as range-trading conditions persist around the 2013 trend-line. At the moment there is little edge given that price is in the middle of the range from 1302 up to 1366. It is best to operate around the perimeters, that is to look for fading opportunities at support and resistance. Eventually the range will break, but until then look for trading opportunities to remain few and of the range variety.
Gold Daily Chart (Range-bound)

For more in-depth analysis, check out the Q2 Forecast for Gold
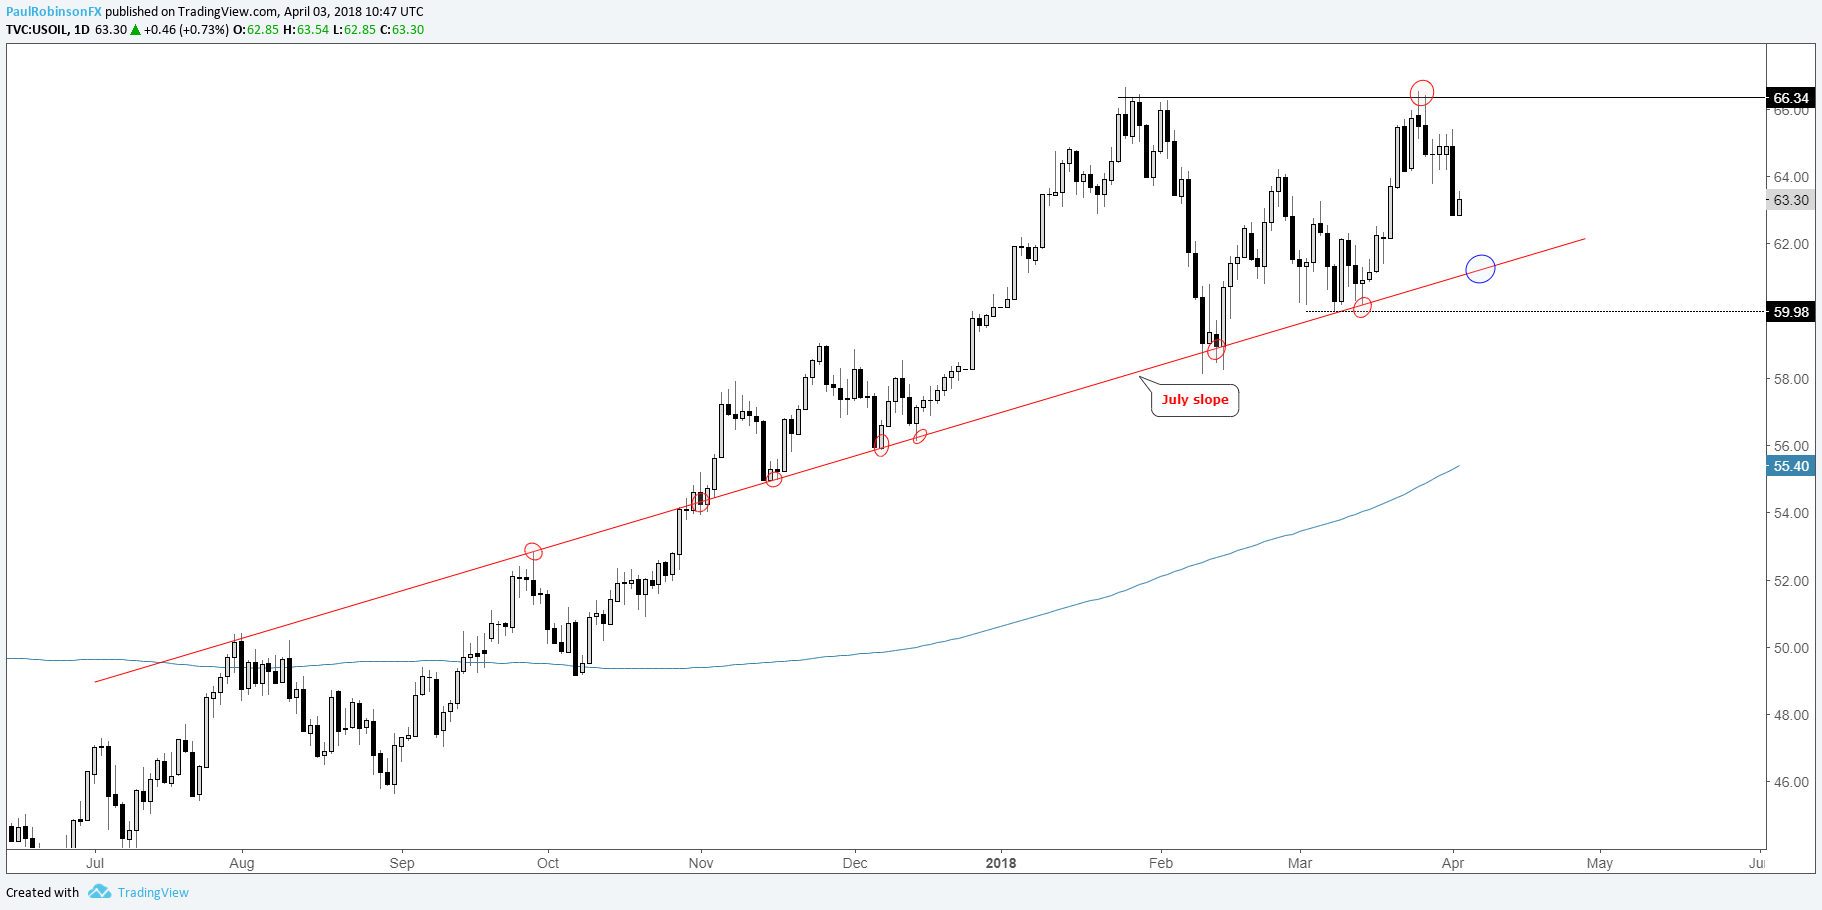
Crude oil turned of January high, watch the July slope
The turn off the January peak has been relatively strong, with it now bringing into view a very important slope extending upward since July. We are using this as our ‘line-in-the-sand’ for keeping a generally bullish or bearish outlook.
On another test, we’ll look to it as a potential buying opportunity should we see bullish price action. On a failure to hold, though, we’ll look to flip the script to a bearish stance. Brent crude has a trend-line from June which is likely to be tested around the same time as the July slope in WTI, it arrives in the 66/65.50-area.
Crude Oil Daily Chart (Watch the July slope)
For more in-depth analysis, check out the Q2 Forecast for Crude Oil
Resources for Index & Commodity Traders
Whether you are a new or an experienced trader, DailyFX has several resources available to help you; indicator for tracking trader sentiment, quarterly trading forecasts, analytical and educational webinars held daily, trading guides to help you improve trading performance, and one specifically for those who are new to forex.
---Written by Paul Robinson, Market Analyst
To receive Paul’s analysis directly via email – SIGN UP HERE
You can follow Paul on Twitter at @PaulRobinsonFX


