


The Elliott Wave analysis for Dow Jones Industrial Average shows the higher probability move is for continued losses. The Elliott Wave chart see a continuation for USDJPY higher.
The video above is a recording of a US Opening Bell webinar from April 2, 2018.
Elliott Wave Analysis for Dow Jones Industrial Average
Dow Jones Industrial Average continues to trade on its heels. We maintain our Elliott Wave forecast for additional losses for DJIA. DJIA appears to be moving lower in impulse waves while correcting higher in three wave structures. Three wave structures are evidence of a correction and that the near term trend is pointed lower.
Under the preferred Elliott Wave count, we are anticipating a third of a third wave lower that may draw DJIA down to 20,000 and possibly lower levels. This forecast remains the higher probability Elliott Wave picture so long as trade is below 25,069.
If DJIA does start to rally, we will become concerned about this Elliott Wave forecast if DJIA rallies above the red trend line. If we are in a third of a third wave, this red trend line should hold down any rallies.
Bottom line, so long as Dow Jones Industrial Average holds below the red trend line that is crossing near 24,500, we believe the path of least resistance is to the down side and a retest of 20,000.

USDJPY Elliott Wave Chart
USDJPY rallied off the channel support as anticipated to 107. We noted last week how the structure of the rally indicates there is stronger short term Elliott Wave bullish pattern after a brief pull back.
It would be completely normal for USDJPY to pull back to near 105.50. At this point, we would have a 5-3 wave pattern and are on the lookout for another bullish reversal.
Therefore, the March 25-28 rally is likely wave ‘A’ of a bullish Elliott Wave zigzag or wave ‘1’ of a bullish impulse wave. Either way, we are anticipating a partial retracement to hold above the March 25 low of 104.63 for a move up towards 108.
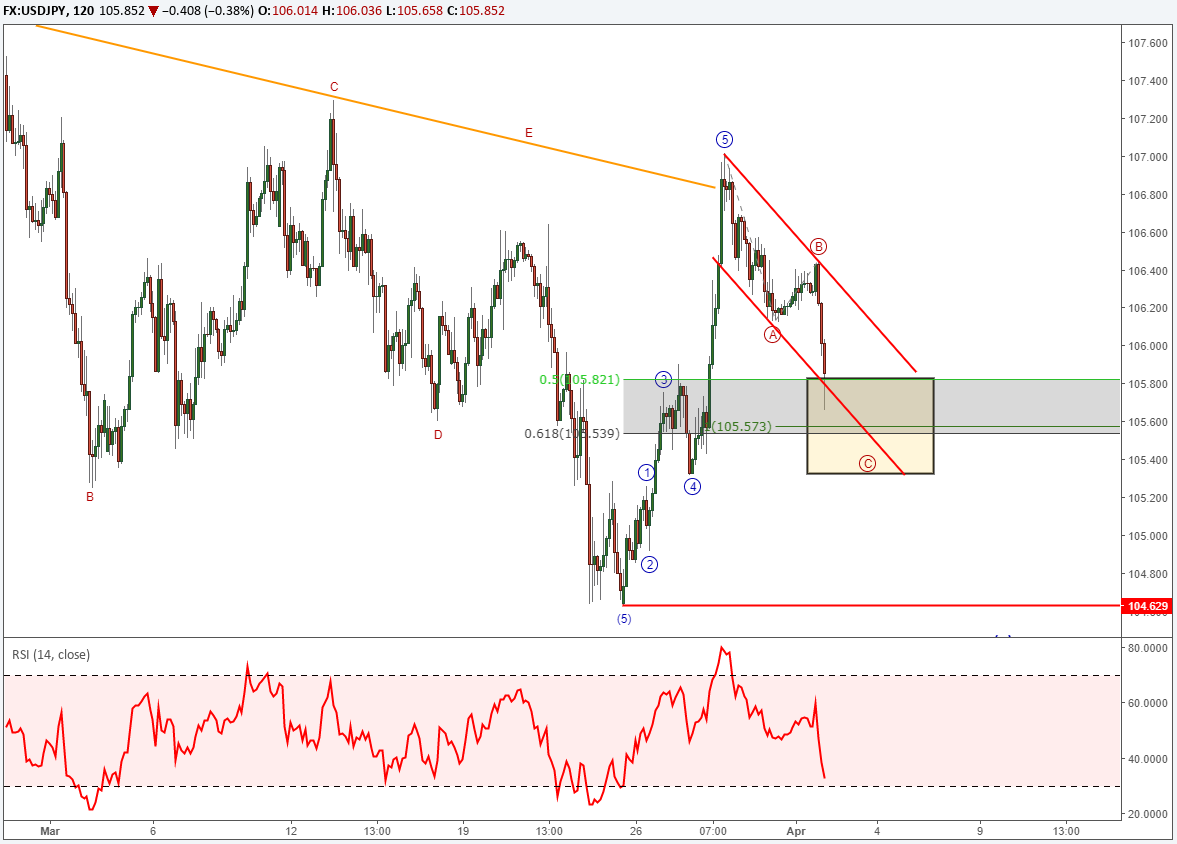
USDJPY sentiment has fallen from last week’s lofty levels and currently rests at +2.1. This fall in sentiment is a reflection of an increase in the number of short traders coupled with a decrease in the number of long traders. This could be a subtle shift below the surface and if sentiment continues to fall, could signal higher prices for USDJPY. Dow Keep an eye on the IG live client sentiment reading.
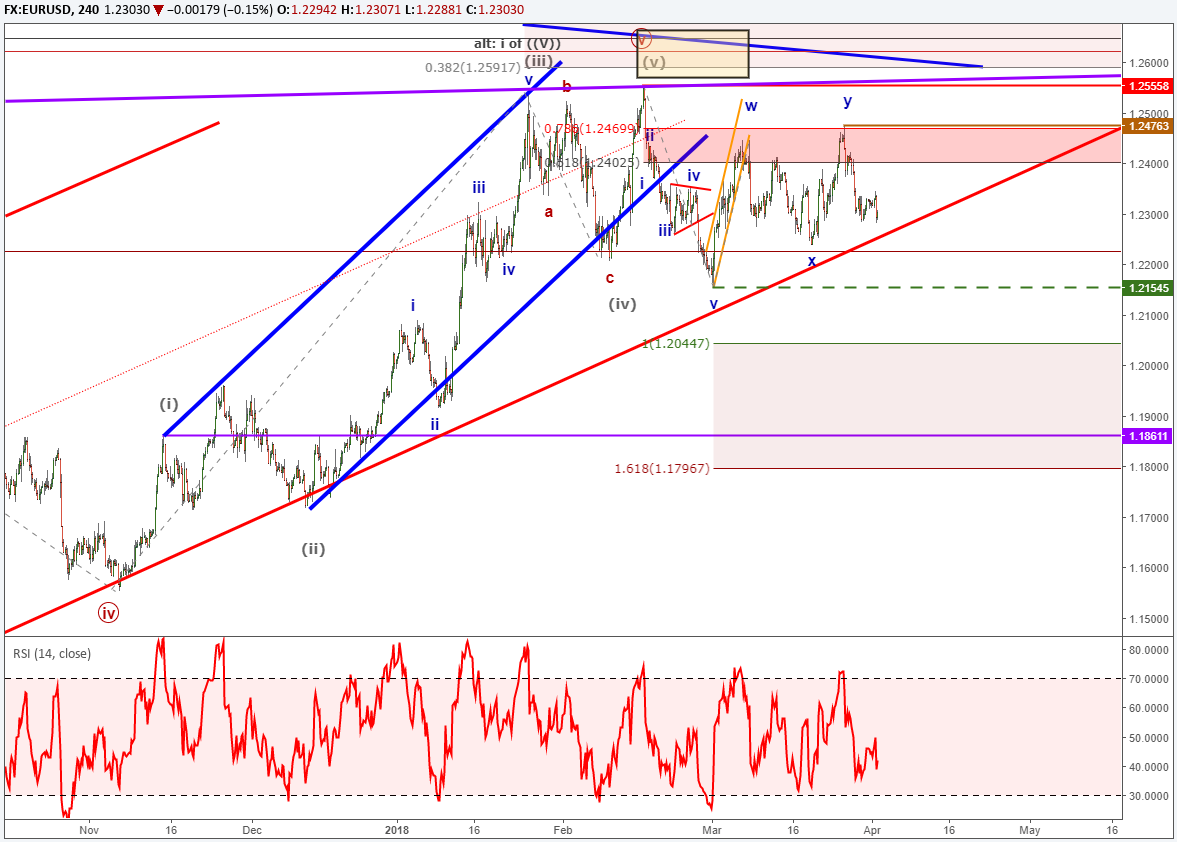
EURUSD Chart Stuck in a Range
Since January 2018 we have been anticipating that a three year expanded flat pattern is ending and that a multi-month high hangs around the corner. On March 19, we established a pending order to short on a EURUSD break down at 1.2153 that has yet to trigger. We will continue with the pending order so long as EURUSD is below 1.2556.
A break below the red upward sloping trend line will be constructive for the bears. This line has contained EURUSD prices for the 2017 up trend. A break below here is an early warning signal of the potential for additional losses.
EURUSD Sentiment Analysis
EURUSD sentiment has increased from last week’s -2.2 to -1.4. Since sentiment is a contrarian signal, this increase in the reading is a clue about a falling EURUSD. If EURUSD does work down towards 1.2153 we would like to see continued evidence of sentiment shifting up higher than -1.4 and that would be a bearish signal. The current live sentiment reading for EURUSD is -1.4.
Bottom line, we are simply sharpening our claws for a bearish entry below 1.2153.
Elliott Wave Theory FAQs
What are Elliott Wave impulse waves?
According to Elliott Wave Theory, the market moves five waves in the direction of the near term trend followed by a three wave counter trend wave. An impulse wave is one of two types of motive waves that denotes trend direction. Therefore, if we see a bearish impulse waveform, then after a three-wave counter trend wave, we can anticipate at least one more bearish motive wave.
For those Elliott Wave technicians looking for further study, read about our expert tips in our beginners and advanced trading guides.
After reviewing the guides above, be sure to follow future Elliott Wave articles to see Elliott Wave Theory in action.
I hear that many traders struggle with profitability, why?
Regardless of the style of analysis, many traders do lose money because they do not take the time to study the market and the effect of leverage. At DailyFX, we have studied millions of live trades and boiled our study down into a Traits of Successful Traders guide. You will find how leverage and human nature affects our trading so you can be better prepared for the next correction.
Elliott Wave Theory can be applied to a variety of highly liquid markets. FX is one of my favorite markets to apply the Elliott Wave principle. Learn more about trading FX with this guide specifically designed for you.
---Written by Jeremy Wagner, CEWA-M
Jeremy Wagner is a Certified Elliott Wave Analyst with a Master’s designation. Jeremy provides Elliott Wave analysis on key markets as well as Elliott Wave educational resources. Read more of Jeremy’s Elliott Wave reports via his bio page.
Communicate with Jeremy and have your shout below by posting in the comments area. Feel free to include your Elliott Wave count as well.
Discuss these markets with Jeremy in Monday’s US Opening Bell webinar.
Follow me on Twitter at @JWagnerFXTrader .
To receive additional articles from Jeremy via email, join Jeremy’s distribution list.


