


Talking Points:
- The end of the month and quarter is a great time to adjust focus and appreciate the big picture - both fundamentally and technically
- Systemic change may be afoot in key areas of the markets, and an appreciate of this shift can better prepare us as traders
- We discuss the monthly and quarterly charts and themes behind the S&P 500, Dollar, Treasuries, VIX, USD/CNY and Oil
What makes for a 'great' trader? Strategy is important but there are many ways we can analyze to good trades. The most important limitations and advances are found in our own psychology. Download the DailyFX Building Confidence in Trading and Traits of Successful Traders guides to learn how to set your course from the beginning.
Make Time to Look at High Time Frame Charts
Most of us would consider ourselves 'short-term' or 'swing' traders. That means we monitor charts that are typically daily or low and our fundamental assessment is more often an assessment of what high profile event risk in the immediate future can charge volatility. There is nothing wrong in setting our time frames to that tempo so long as it fits our temperament and our strategy is properly tailored to navigate the conditions that will highlight. However, even if we do trade on that shorter time frame, it is important to analyze the markets from a bigger picture perspective from time to time. It helps us to register technical cues that would be lost on lower periodicity, appreciate the momentum building behind fundamental themes and to pick up certain conditional factors that can contribute to a change in market structure. There is no better time to schedule a shift to the big picture than at the end of a quarter, and that is what we do in this video.
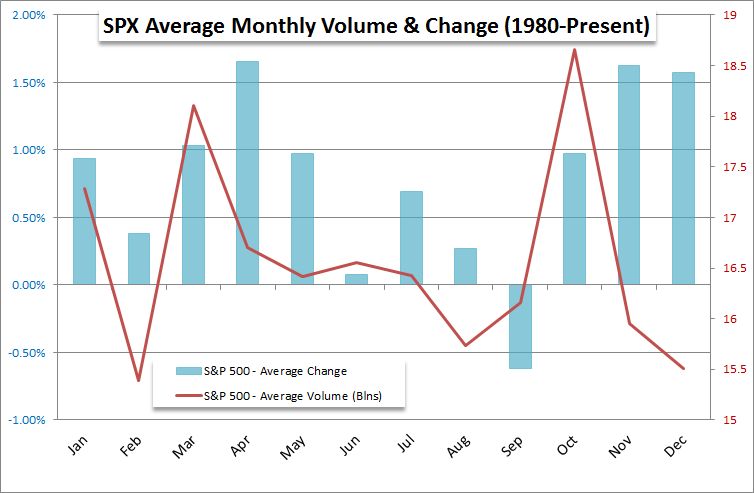
The Monthly and Quarterly View of the S&P 500
As I have described before, the S&P 500 is one of the most important individual benchmarks in the financial system. It reflects the most commonly held asset (equities) for the most frequently employed strategy (buy and hold) in the largest economy and market in the world. When you add all these qualities together, you have one of the most appropriate - though not necessarily highly tuned - measures of 'risk trends' in the entire financial system. The volatility we have seen over the past two months was remarkable and was treated like a refreshing rai after a long drought for speculators on both side of the market. Bears saw - likely prematurely - as the long-awaited turn and bulls were happy for a more substantial dip to buy. Yet, when you move to the monthly chart, you appreciate better how far we are stretched and how divergent from traditional 'value'. A quarterly chart registers the first bearish candle following a nine-consecutive quarter advance - matching the longest run in a two decades.

Volatility is an Important Vehicle and Feature of the Landscape
What is vital to take away from this index - and others - though is the level of volatility in general. Volatility is a quality to the market that can facilitate transition. It can turn range bound markets to breakouts and trends. It can also turn bullish trends to bearish ones. There is a difference however in the volatility we use as a measure of systemic change and the novel means for finding a little more market movement to trade. In the past few years we have seen a dramatic rise in volatility-based products from the longer-run futures to the more recently introduced ETFs. These have been less and less utilized as a hedge and more pursued purely because it offered traders a little more of what they have severely lacked: volatility in price action. Swings in markets are how most trades are positioned nowadays whether that is a buy-and-hold capital gains pursuit for equities or the back and forth of more speculative favorites. The inverse VIX ETFs were a story of how far traders have reached just to earn a few more basis points of return on already stretched portfolios. And that is a significant stretch of risk and source of instability into the future.

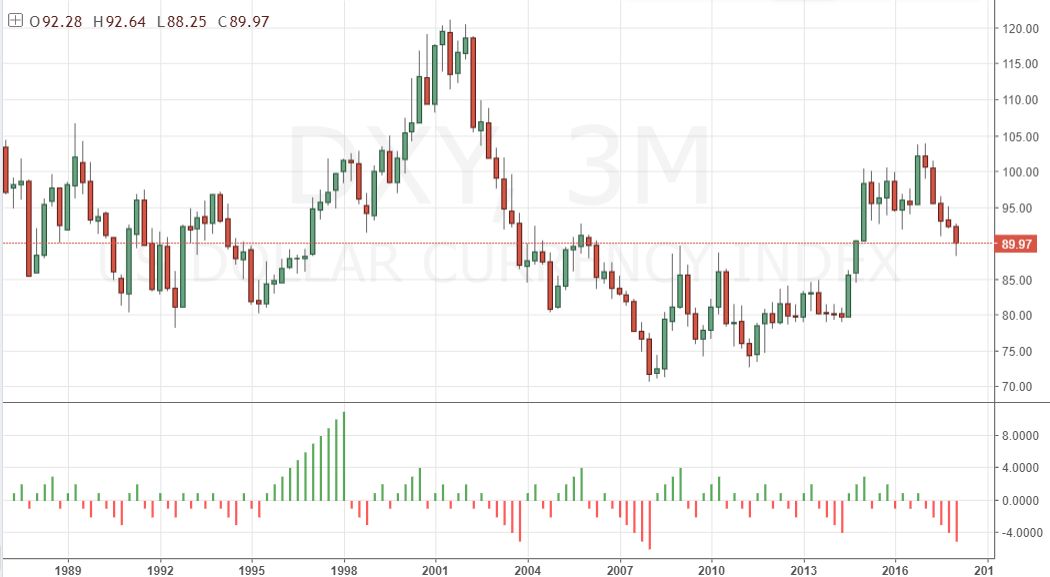
Dollar and Yields
The Dollar has spent the past few months in a broader range - much to the frustration of many FX traders hoping for the eventual break of EUR/USD. Yet, we forget that the general trend is one of significant bearishness until we look at more historical price action. In fact, a quarterly chart of the DXY Index shows a five-month slide for the benchmark which is its worst showing since it bottomed out at the beginning of 2008. I do not think this alone is a good sign of a bottom. Quite the opposite as we find in the monthly chart a critical technical pattern in a head-and-shoulders that broke its neckline at the start of the year and how consolidated on the action side of breakdown. Recovery or sustained slide depends on a few crucial fundamental factors. Monetary policy was a key driver and will likely be again in the future, but more likely as the distortion that it will cause on the way out matching its impact on the way in. Furthermore, the high yield makes it a risk currency while its safe haven status would readily kick back in should severe distress sweep in. Treasuries and their yields offer a similar picture of this fundamental web that has been spun to temporarily brace the market. So what happens when it is withdrawn? We take a big picture (monthly and quarterly) look at charts and fundamentals for the S&P 500, VIX, Dollar, Yields, USD/CNH and oil in this quarter-end Strategy Video.
To receive John’s analysis directly via email, please SIGN UP HERE


