


The euro continues to find difficulty at the 2008 trend-line, more choppiness could be in store with the possibility of a triangle forming. USD/JPY remains vulnerable to ‘risk-off’, having difficulties at resistance. The S&P 500 is sitting just above major ‘make or break’ support.
Technical Highlights:
- EUR/USD stuck beneath 2008 trend-line
- USD/JPY impacted by risk, finding resistance at prior low
- S&P 500 at a big cross-road of trend-line, 200-day MA
Check out the DailyFX Top Trading Opportunities for 2018 on the DailyFX Trading Guides page.
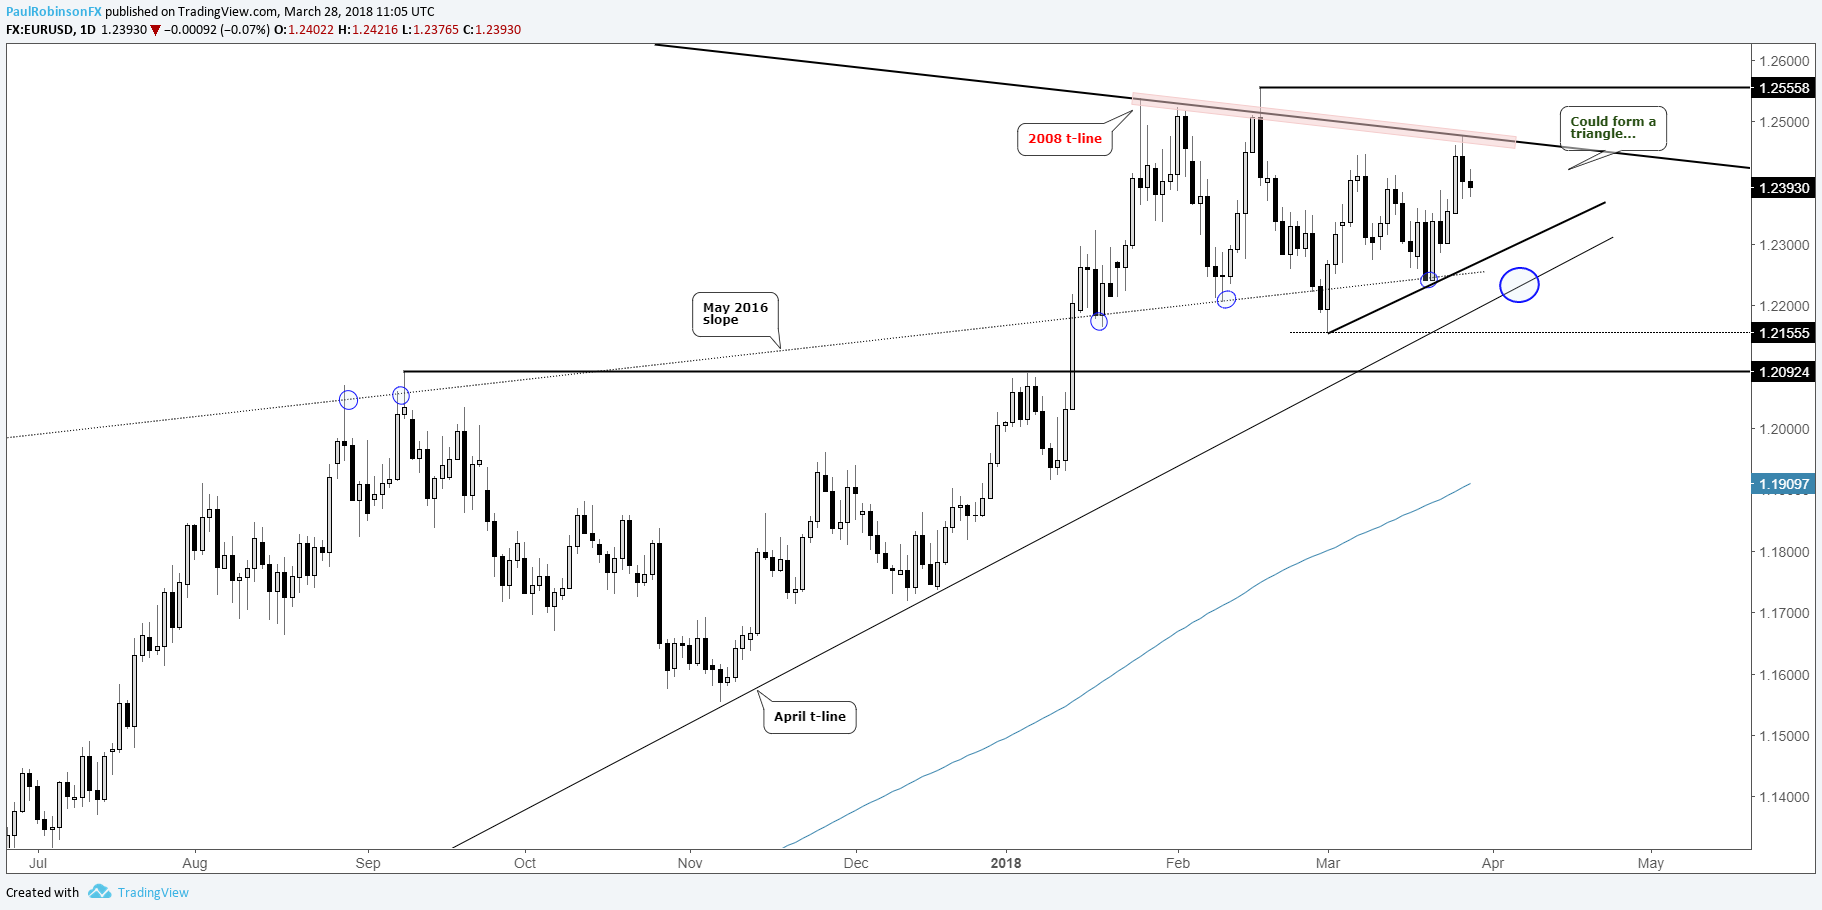
EUR/USD stuck beneath 2008 trend-line
The euro continues to find stiff opposition around the 2008 trend-line, which has the short-term bias turned back lower. With more time, a triangle could come into play with the underside trend-line rising up from the monthly low. If this comes to fruition it could lead to an explosive move later on, but for now the trading could be a bit difficult.
See how current positioning in various markets/FX pairs could signal their next moves on the IG Client Sentiment page.
EUR/USD Daily Chart (2008 trend-line resistance)
USD/JPY impacted by risk, finding resistance at prior low
USD/JPY turned lower yesterday at the earlier-month low, but is in the process of overcoming that high at the time of this writing. The bearish channel is still in play up to the upper parallel. As long as USD/JPY stays confined within, then the outlook will remain generally bearish.
Keep an eye on the S&P 500 as it is at a critical crossroad, and if it soon breaks the confluence of support at the 200-day MA and Feb 2016 trend-line then JPY is very likely to put pressure on not only USD but across the board.
USD/JPY Daily Chart (Bearish Channel)

In FX, we also looked at GBPUSD, USDCHF, AUDUSD, NZDUSD, USDCAD, GBPJPY, EURJPY, AUDJPY, CHFJPY, CADJPY, USDMXN, and a few others.
S&P 500 at a big cross-road of trend-line, 200-day MA
The S&P 500 as we wrote about yesterday, is at a major crossroad consisting of the 200-day MA and Feb 2016 trend-line. It is holding for now, but a break is seen as causing global stocks to take another big leg lower, as well as other risk-related assets reacting.
Should it hold, the market will live to fight another day, but for how long is uncertain. The overall outlook is bearish, but we’ll continue to abide by support for as long as it holds before switching aggressively into full-on ‘risk-off’ mode.
S&P 500 Daily Chart (Major cross-road at its feet)

Resources for Forex & CFD Traders
Whether you are a new or an experienced trader, DailyFX has several resources available to help you; indicator for tracking trader sentiment, quarterly trading forecasts, analytical and educational webinars held daily, trading guides to help you improve trading performance, and one specifically for those who are new to forex.
---Written by Paul Robinson, Market Analyst
To receive Paul’s analysis directly via email – SIGN UP HERE
You can follow Paul on Twitter at @PaulRobinsonFX


