


The euro looks headed for more weakness, but it may only be corrective in nature if levels below act supportive. GBP/JPY recently broke big support and is now putting it to test as resistance. Crude oil could be on the verge of a big move, has an important slope to watch.
Technical Highlights:
- EUR/USD looks headed lower with the dollar in rebound mode
- GBP/JPY is pressing up against former support turned resistance
- Crude oil has a slope of interest, developing chart pattern
To see DailyFX analysts’ Top Trading Opportunities for 2018 and educational content, check out the DailyFX Trading Guides page.
EUR/USD looks headed lower with the dollar in rebound mode
EUR/USD heading into the week was viewed as possibly running into trouble once it was done bouncing from last week’s low. After yesterday’s turnabout from the underside of the December trend-line, a lower high appears to have been cemented.
There is support in the 12100/150-area which will become very critical should a decline unfold down to that point. It’s quite possible the price action since late-January is only corrective and not a top, which is why a decline into the aforementioned support will be watched closely. But there is still room to decline in the short-term, so we’ll run with a near-term short-bias.
EUR/USD Daily Chart (Rolling over from lower high)

Other USD-related currencies we looked at included the US Dollar Index (DXY) itself, then USD/CHF, GBP/USD, USD/JPY, AUD/USD, NZD/USD, and USD/CAD.
GBP/JPY is pressing up against former support turned resistance
GBP/JPY broke big support on the final trading day of February, bringing into play the prospect of lower prices. The confluence of support is now significant resistance. The trio of resistance is made up of price levels extending back to December 2016, October 2016 trend-line, and the 200-day MA.
If we are to see GBP/JPY to maintain a bearish outlook it will be important to maintain below all three noted levels/lines on a closing daily basis. Support is clocking in at the moment as a trend-line from April 2017. A turn down and break of this line should get price rolling back downhill. However, should a strong push up into the 14900s develop, then we’ll need to ease off on a bearish outlook.
See how trader positioning in various pairs/markets could impact their next moves on the IG Client Sentiment page.
GBP/JPY Daily Chart (Testing resistance)

Other yen-crosses examined were CHF/JPY, AUD/JPY, and NZD/JPY.
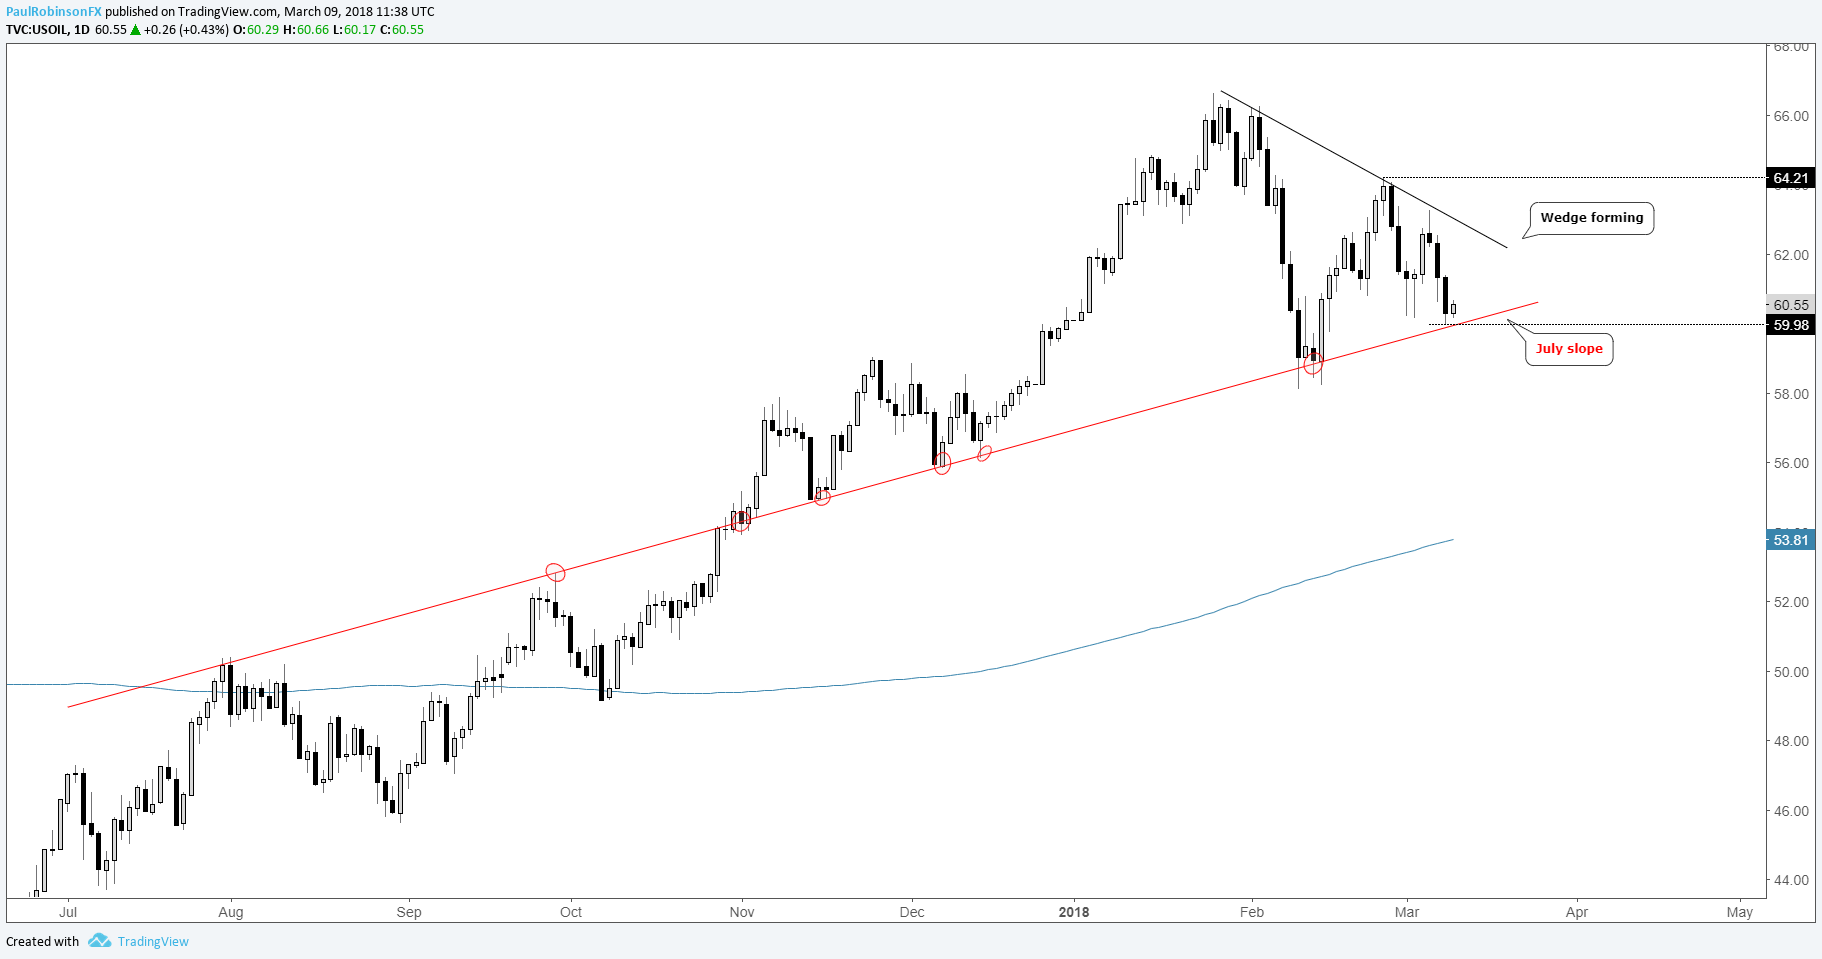
Crude oil has a slope of interest, developing chart pattern
WTI crude oil has a major slope of interest coming back into play. The angle started back in July and has been quite influential on several occasions, making it the ‘line-in-the-sand’. A broad wedge is developing with the help of the July slope, and with a little more time could make for an explosive situation.
In-line with the broader trend and support, a breakout to the top-side is certainly possible, but so is a failure to the downside – that’s the nature of wedges, they can resolve in either direction. A downside break could hold a more potent move, though, as the speculative long position in the futures market is massive at over 700k contracts held by large speculators. A reversal in the bullish trend dating back to last year could spark a major unwind of this historically large position.
WTI Crude Oil Daily Chart (Slope support, wedge forming)
We also peeked at gold in the commodity space.
Resources for FX & CFD Traders
Whether you are a new or experienced trader, we have several resources available to help you; indicator for tracking trader sentiment, quarterly trading forecasts, analytical and educational webinars held daily, trading guides to help you improve trading performance, and one specifically for those who are new to forex.
---Written by Paul Robinson, Market Analyst
To receive Paul’s analysis directly via email – SIGN UP HERE
You can follow Paul on Twitter at @PaulRobinsonFX


