


The weakness in USD Index may have one more dip coming when analyzing through Elliott Wave Theory. After this dip, USD Index may stage its largest rally since January 2017.
The video above is a recording of a US Opening Bell webinar from February 5, 2018.
In today’s US Opening Bell webinar, we discussed key markets using Elliott Wave Theory such as (and not in this order) DXY, EUR/USD, USD/JPY, GBP/USD, AUD/USD, NZD/USD, Oil and Gold.
The US Dollar Index (DXY) is consolidating sideways in fourth wave of an Elliott Wave impulse wave. This sideways consolidation could be an Elliott Wave triangle pattern. When wave (iv) finishes, that means we will anticipate a fifth and final wave to new lows. We believe this last push into new lows may set the stage for the largest US Dollar Index rally since January 2017.
Elliott Wave Chart for Dollar Index

Applying the Elliott Wave principle to the chart above, we can see a sideways consolidation in wave (iv) that may carry further this week. Fifth wave measurements stretch down to 87.40 so we will look for signs of a reversal should DXY make it that low. Once the fifth wave is in place, we anticipate a rally back up towards 95-98 that reflects the largest rally since January 2017.
EUR/USD Elliott Wave Analysis Shows Reversal Looming
The mirror opposite is taking hold within EUR/USD. EURUSD has recently pressed new highs. It appears to us that wave (iii) within circle wave ‘v’ was extended as wave (iii) was 2.618 times the length of (i).
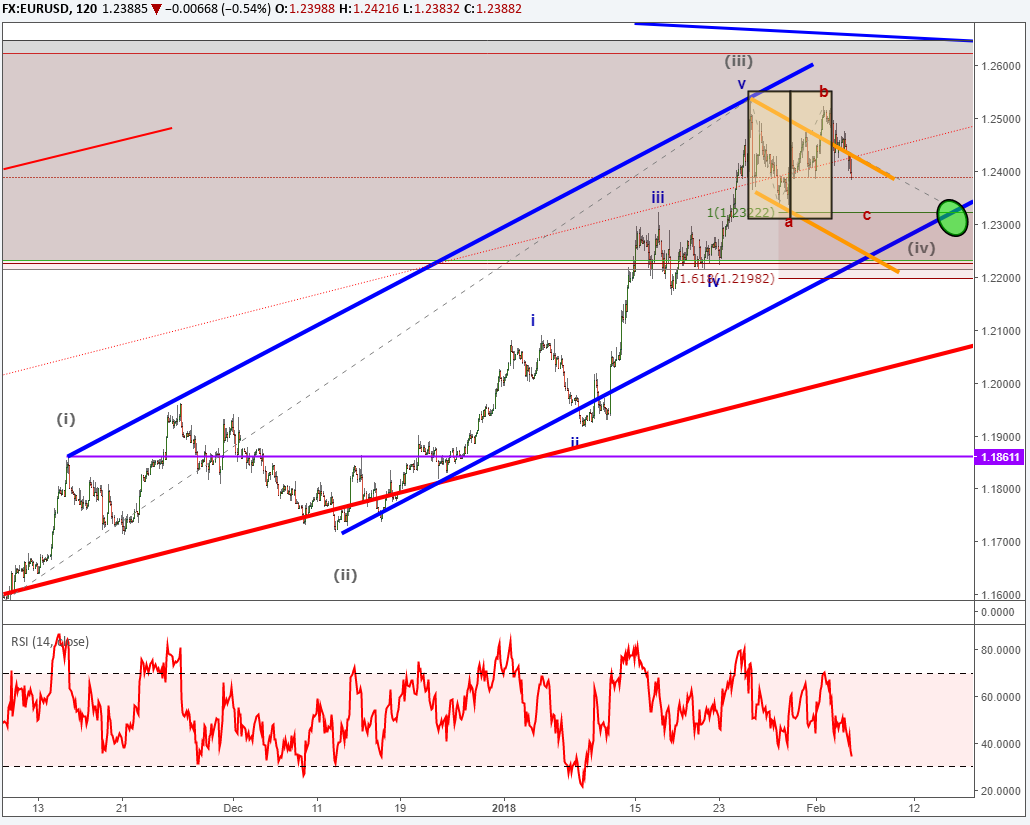
If indeed EUR/USD has just finished the third wave of an Elliott Wave impulse pattern, then the fourth wave is currently underway. After a little more sideways consolidation, we are anticipating another run towards the 1.25-1.26 highs. The final high in wave (v) would finish a three year long Elliott Wave expanded flat pattern on EUR/USD.
EURUSD Sentiment Analysis
EURUSD continues to spark bullish signals through its sentiment reading. This reaffirms that we may see some more strength in EUR/USD prior to a meaningful reversal. The current live sentiment reading for EURUSD is -2.21. Sentiment is used best as a contrarian tool, which is a bullish signal for EURUSD now.
If wave (v) embarks higher, look for sentiment to shift towards bulls to help confirm the wave five top as sentiment is a contrarian tool. This bullish shift could be structured with bears giving up or the number of traders net-long increasing (or a combination of both).
Elliott Wave Frequently Asked Questions
How does Elliott Wave know the cycle is about to end?
Elliott Wave Theory is a study of wave patterns and their structure. Since we can nearly count a five-wave impulse as complete, that is warning us that a large rally is looming nearby. Therefore, we scale down to a smaller time frame and see that within the fifth wave, it is nearly complete in carving five waves. Since the market is fractal, we can keep zooming in and seeing these wave forms develop on smaller time scales. Continue your Elliott Wave education by reading our beginners and advanced Elliott Wave guides that will cover some of the basic patterns and how to trade with Elliott Wave Theory.
What markets is Elliott Wave Theory best applied to?
Elliott Wave Theory is best applied to the more liquid markets. Therefore, you will see me apply my analysis to major and common FX pairs, stock indices, common commodities like gold, silver, copper, and energy like oil or natural gas.
If you are not sure if Elliott Wave is for you, consider reading these materials that will help you get started in trading FX with some commentary on the habits that make successful traders.
---Written by Jeremy Wagner, CEWA-M
Jeremy Wagner is a Certified Elliott Wave Analyst with a Master’s designation. Jeremy provides Elliott Wave analysis on key markets as well as Elliott Wave educational resources. Read more of Jeremy’s Elliott Wave reports via his bio page.
EURUSD and Gold were two markets covered in the December 27 webinar “What to Watch For in 2018”. Watch a recording by registering here.
Discuss these markets with Jeremy in Monday’s US Opening Bell webinar.
Follow me on Twitter at @JWagnerFXTrader .
To receive additional articles from Jeremy via email, join Jeremy’s distribution list.


