


Bitcoin price bounce takes the shape of an Elliott Wave correction, which suggests a retest of recent lows. EUR/USD nears the 10-year trend line as the three year Elliott Wave flat pattern matures.
The video above is a recording of a US Opening Bell webinar from January 29, 2018.
In today’s US Opening Bell webinar, we discussed key markets using Elliott Wave Theory such as (and not in this order) Bitcoin, DXY, EUR/USD, USD/JPY, AUD/USD, USD/CAD, and Gold.
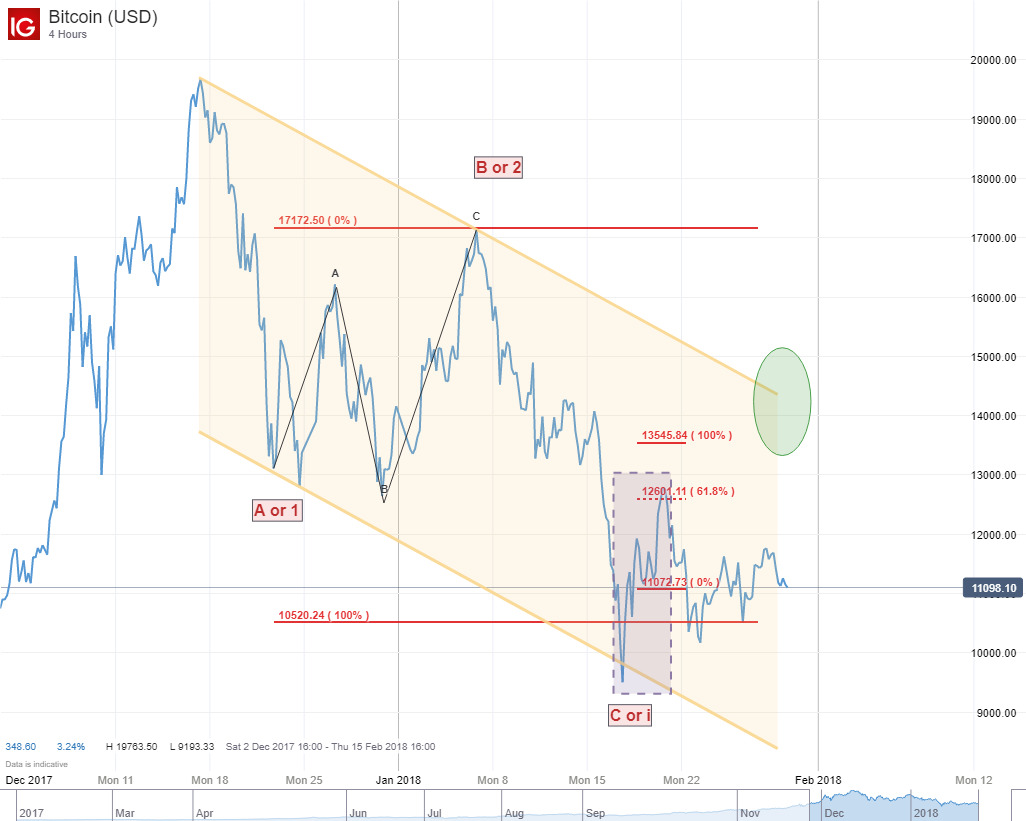
The Elliott Wave chart for Bitcoin (BTC) illustrates a continued bearish trend and retest of January lows. The bounce from January 17 has not taken shape of a motive wave. As a result, the bounce is likely corrective and may be completely retraced. Our Elliott Wave analysis shows $14,000 as a key level for bears to watch. A break above the resistance trend line does not mean the bulls of out of the woods. It likely means the corrective pattern that began from the December highs are extended in time. Below $14,000 and Bitcoin prices remain on their back foot with patience.
Learn more on Bitcoin by reading our introduction to Bitcoin trading guide.
EUR/USD Elliott Wave Analysis
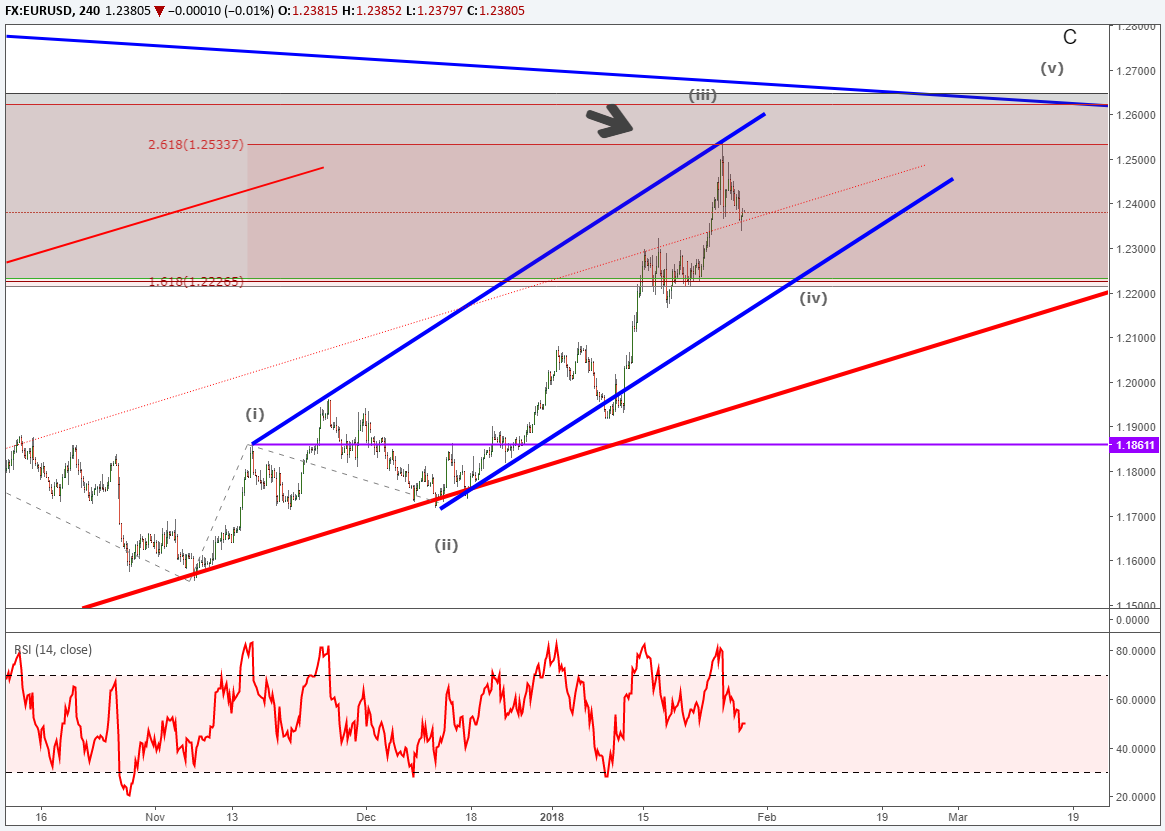
Both EUR/USD and DXY extended their 3rd waves towards US Dollar weakness. EUR/USD pivoted right at a 2.618 extension, which is a common wave relationship for third waves. We think both EUR/USD and DXY are in wave (iii) of v in an Elliott Wave impulse pattern. That implies we are anticipating a little bit of EUR/USD weakness that may drop to 1.2170-1.2230 to finish up wave (iv). Then, we are anticipating another run towards the 1.25-1.26 highs. The final high in wave (v) would finish a three year long Elliott Wave expanded flat pattern on EUR/USD.
The opposite would be true for US Dollar Index in that a recovery to near 90-91 is normal within this context of the wave pattern to finish wave (iv).
EURUSD Sentiment Analysis
We have seen little change in the sentiment readings for EUR/USD since last Monday’s Elliott Wave webinar. If wave (v) embarks higher, look for sentiment to shift towards bulls to help confirm the wave five top as sentiment is a contrarian tool. This bullish shift could be structured with bears giving up or the number of traders net-long increasing (or a combination of both).
Elliott Wave Frequently Asked Questions
How many waves are in an Elliott Wave cycle?
Elliott Wave Theory is a study of wave patterns and their structure. A complete Elliott Wave cycle consists two waves…a bullish wave followed by a bearish wave. If we inspect the sub waves of the bullish and bearish waves, we will see them subdivide as a 5-3 waveform. The means the first major wave consisted of five waves and the second major wave consisted of three waves. Since the market is fractal, we can keep zooming in and seeing these wave forms develop on smaller time scales. Continue your Elliott Wave education by reading our beginners and advanced Elliott Wave guides that will cover some of the basic patterns and how to trade with Elliott Wave Theory.
How do you know when a wave is finished?
According to Elliott Wave principle, each wave consists of a certain number of sub-waves depending upon the pattern. Once you can completely count all of the waves present, then the market is at risk of reversal. Naturally, we will not know for sure until some point after the reversal has taken place. However, we can anticipate price zones where a reversal is higher probability. As a trader, once the market reaches those price zones, I wait for a break of support or resistance trend lines to validate my view and enter the trade. Good trading is more than entry or exit signals, it also involves a risk management plan.
A good way to get started is to read our New to Forex guide. Then, as a follow up, it is important to understand the habits that make traders successful.
---Written by Jeremy Wagner, CEWA-M
Jeremy Wagner is a Certified Elliott Wave Analyst with a Master’s designation. Jeremy provides Elliott Wave analysis on key markets as well as Elliott Wave educational resources. Read more of Jeremy’s Elliott Wave reports via his bio page.
Communicate with Jeremy and have your shout below by posting in the comments area. Feel free to include your Elliott Wave count as well.
USD/JPY and as well as EUR/JPY, GBP/JPY, and AUD/JPY were markets discussed in Jeremy’s January 3 webinar forecasting 2018 trends. Watch a recording by registering here.
Discuss these markets with Jeremy in Monday’s US Opening Bell webinar.
Follow me on Twitter at @JWagnerFXTrader .
To receive additional articles from Jeremy via email, join Jeremy’s distribution list.


