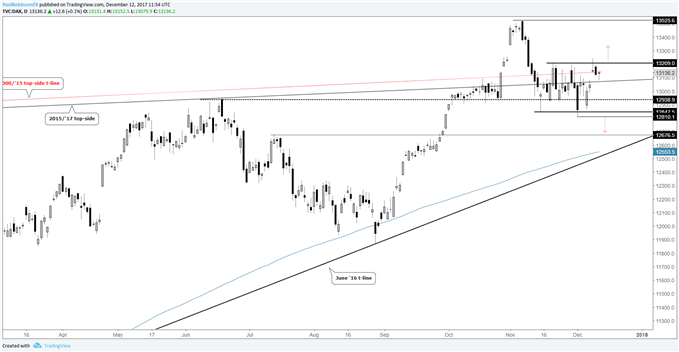
Gold and silver look poised to remain weak until at least support levels below are tested. Copper, too. Crude oil is hanging tough despite positioning headwinds; giving trend the benefit of the doubt for now. The DAX remains in a range, levels outlined.
Highlights:
- Gold and silver are seeing heavy selling as evidenced by the most recent CoT report, more likely to come as big support lies further down; copper remains vulnerable
- WTI and Brent crude oil are both hanging tough, especially the latter; positioning concerns have yet to matter, going with trend higher for now
- The DAX remains range-bound, need a confirmed break before running with a bias
Increase your knowledge with Market Forecasts & Trading Guides.
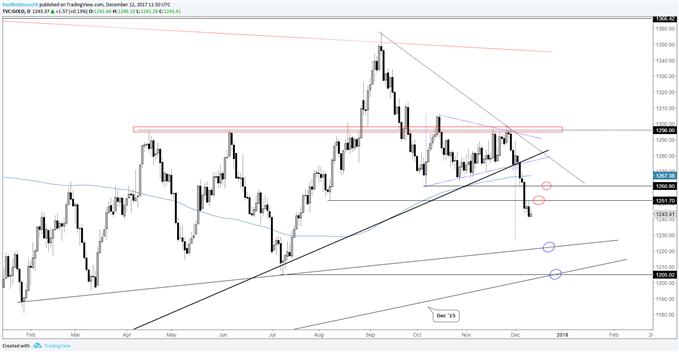
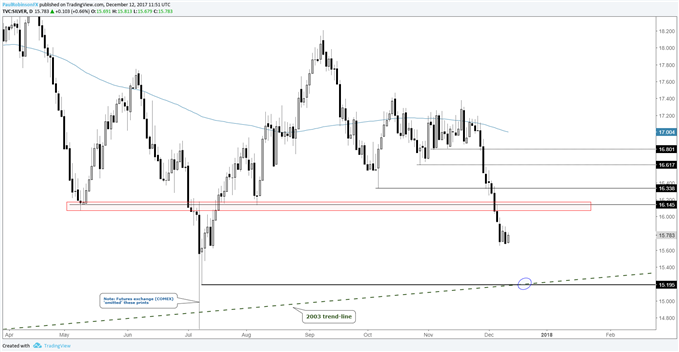
Gold has been in a bit of a free-fall lately, and the technical picture doesn’t favor the decline ending yet. Resistance comes in at 1251/61 on bounces, with targeted support not arriving until the 1220s down to around 1205. Silver is making gold look ‘strong’ with its plunge this month. It is well below the first area of resistance around 16.14 and may not sustain a bounce that high before selling continues. Targeting very long-term support by way of a trend-line dating back to 2003. This trend-line is alignment with the July low of 15.19.
Speculative selling in the futures market has recently registered historical readings in precious metals, with silver, according to the latest CoT report, seeing the largest one-week change in positioning on record. This behavior smacks of capitulation-type selling, but until we see big support levels touched we’ll just keep in mind that it could come to indicate longer-term oversold conditions later on.
Gold:Daily
Silver: Daily
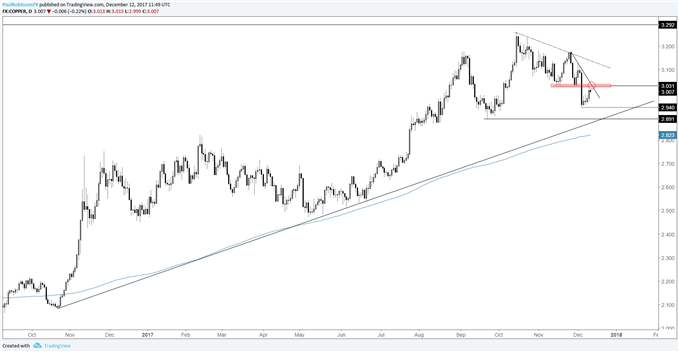
Copper is sporting a bearish sequence, with 3.03 viewed as a spot to look for it resume trading lower. There is confluence between horizontal resistance and a trend-line in that area. Looking lower, the next level of support arrives around 2.89.
Copper: Daily
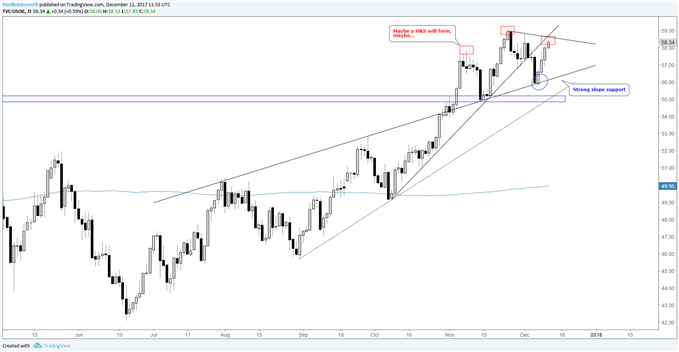
US crude oil turned lower to make a lower high last week as we discussed, but found an impressive amount of support on a slope dating back to July. This keeps the trend structure pointed higher for now despite it coming under increasing pressure. One bearish possibility may be taking shape, but we’ll need to see a turn lower unfold very soon for it to become a realistic scenario. A ‘head-and-shoulders’ pattern could form. If it does, there are two interesting points here. First, the ‘neckline’ is the July slope which it just bounced off of, and second, large speculators are holding a record long number of futures contracts. The break off the slope, in of itself, is enough to turn the picture bearish, but the ‘overly bullish’ market would become a large source of selling which could accelerate any break seen. But, again, the trend is still higher and until we see bearish price action takeover we will maintain a neutral to bullish outlook.
US Oil: Daily
The DAX remains stuck in a volatile range. It will take a strong break into the 13200s or into the low 12800s to spark momentum. It seems likely a top-side break will unfold, but given the nature of ranges it’s prudent to just react to the breakout versus predict it. The FTSE 100 is working on breaking the lower-low, lower-high sequence it has been stuck in, if it does then the 7550/600 area may soon come into focus. The S&P 500 is very near the top-side trend-line from last year which put a lid on it last Monday. This may prove to be good resistance again in the short-term. Overall, weakness through year-end looks likely to be met with buyers, and the market looks poised to close at or very near record highs when all is said-and-done.
See what retail traders are doing in markets on the IG Client Sentiment page.
DAX: Daily
For full technical considerations, please see the video above…
---Written by Paul Robinson, Market Analyst
To receive Paul’s analysis directly via email – SIGN UP HERE
You can follow Paul on Twitter at @PaulRobinsonFX.


