
Volatility is pushing extremes similar to the markets that the popular indicators are drawn from. Yet, unlike popular assets like US shares, there is a natural limit as to how far activity measures can reach. An the mean reverting nature of such markets can signal a systemic change in conditions and opportunity.
Talking Points:
- Volatility measures can offer a more insightful view of sentiment in a market buffered by complacency
- The VIX volatility index is the standard bearer for activity and sentiment, but there are plenty of readings for duration and asset
- There are clear technical patterns on the VIX and VXST which may be less immune to such analysis than what we've seen in the past
What makes for a 'great' trader? Strategy is important but there are many ways we can analyze to good trades. The most important limitations and advances are found in our own psychology. Download the DailyFX Building Confidence in Trading and Traits of Successful Traders guides to learn how to set your course from the beginning.
There are many different measures for 'risk' or investor sentiment. Yet, in an environment where complacency seem a constant reset for the truly troubled financial system, it can seem that we have set a new normal where the markets simply remain preternaturally quiet. We know rationally that is not the case, but the persistence of complacency dulls our ability to assess extremes and thereby timing for an earnest rebalancing. This seems especially true when we have price action like the sort we've seen from the S&P 500 over this past Friday and Monday. Just this past session, the benchmark equity index posted its biggest gap higher on the open in 7 months and then went on to close the day lower. That was the opposite charge and correction that we had seen the previous trading day. This leaves us feeling whiplash and leaves us questioning analysis and the market's connection to natural oscillations. It is not wise however to bet against gravity in all its forms.
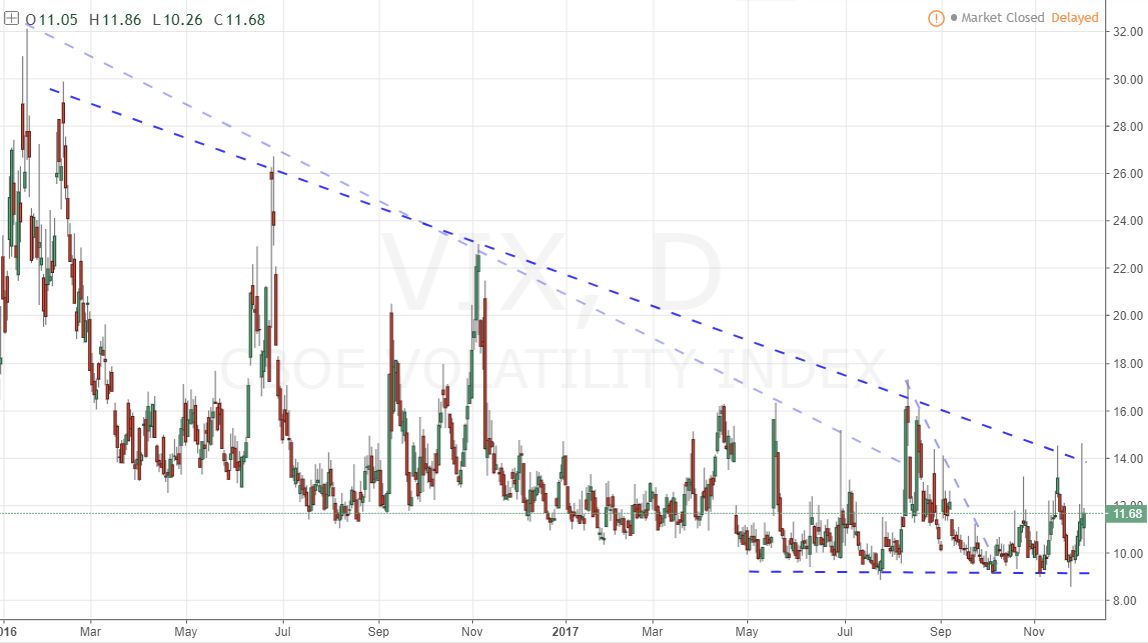
As controversial an asset class as it has been these past years and months, one of the best measures to gauge anxiety and instability are volatility indices. Benchmarks like the VIX volatility index (based on the 1-month implied volatility derived from S&P 500 options) have offered similarly extreme readings as various underlying markets. However, unlikely the theoretically unlimited upside for a share or index - heavy emphasis on 'theoretical' - there are natural lows to the volatility measures. And, we are arguably at this lower thresholds. Activity is mean reverting and the longer we sustain extreme levels the greater the impetus for rebalancing becomes. While I normally would not perform traditional technical analysis on such derivatives of activity, the securitization of the volatility market (futures, ETFs, CFDs and more) produces a 'dog wags the tail' potential. What we seen in the VIX is consolidation into a historical low - in other words a descending triangle where the floor is a record. Eventually, this measure reaches a terminus when the proper catalyst taps the anxiety that has otherwise bubbled beneath the surface.
The traditional VIX is not the only measure to keep track of. There are measures of implied activity on the US equities market that range short-term (1-week based VXST) to medium-term (3-month weighted VXMT). There are further volatility readings that assess other asset classes. Activity readings for the FX market, commodities (GVZ, OVX), emerging markets (VEEM), Treasuries and more exists. And, just as the underlying assets' correlation can reflect a universal motivation and conviction, the relationship between volatility readings can also speak to a market-wide conviction. We discuss volatility measures and their use in our analysis in today's Quick Take Video.
To receive John’s analysis directly via email, please SIGN UP HERE.