


Enjoy the video? Join Paul Tuesday-Friday each week – for details, see the Webinar Calendar.
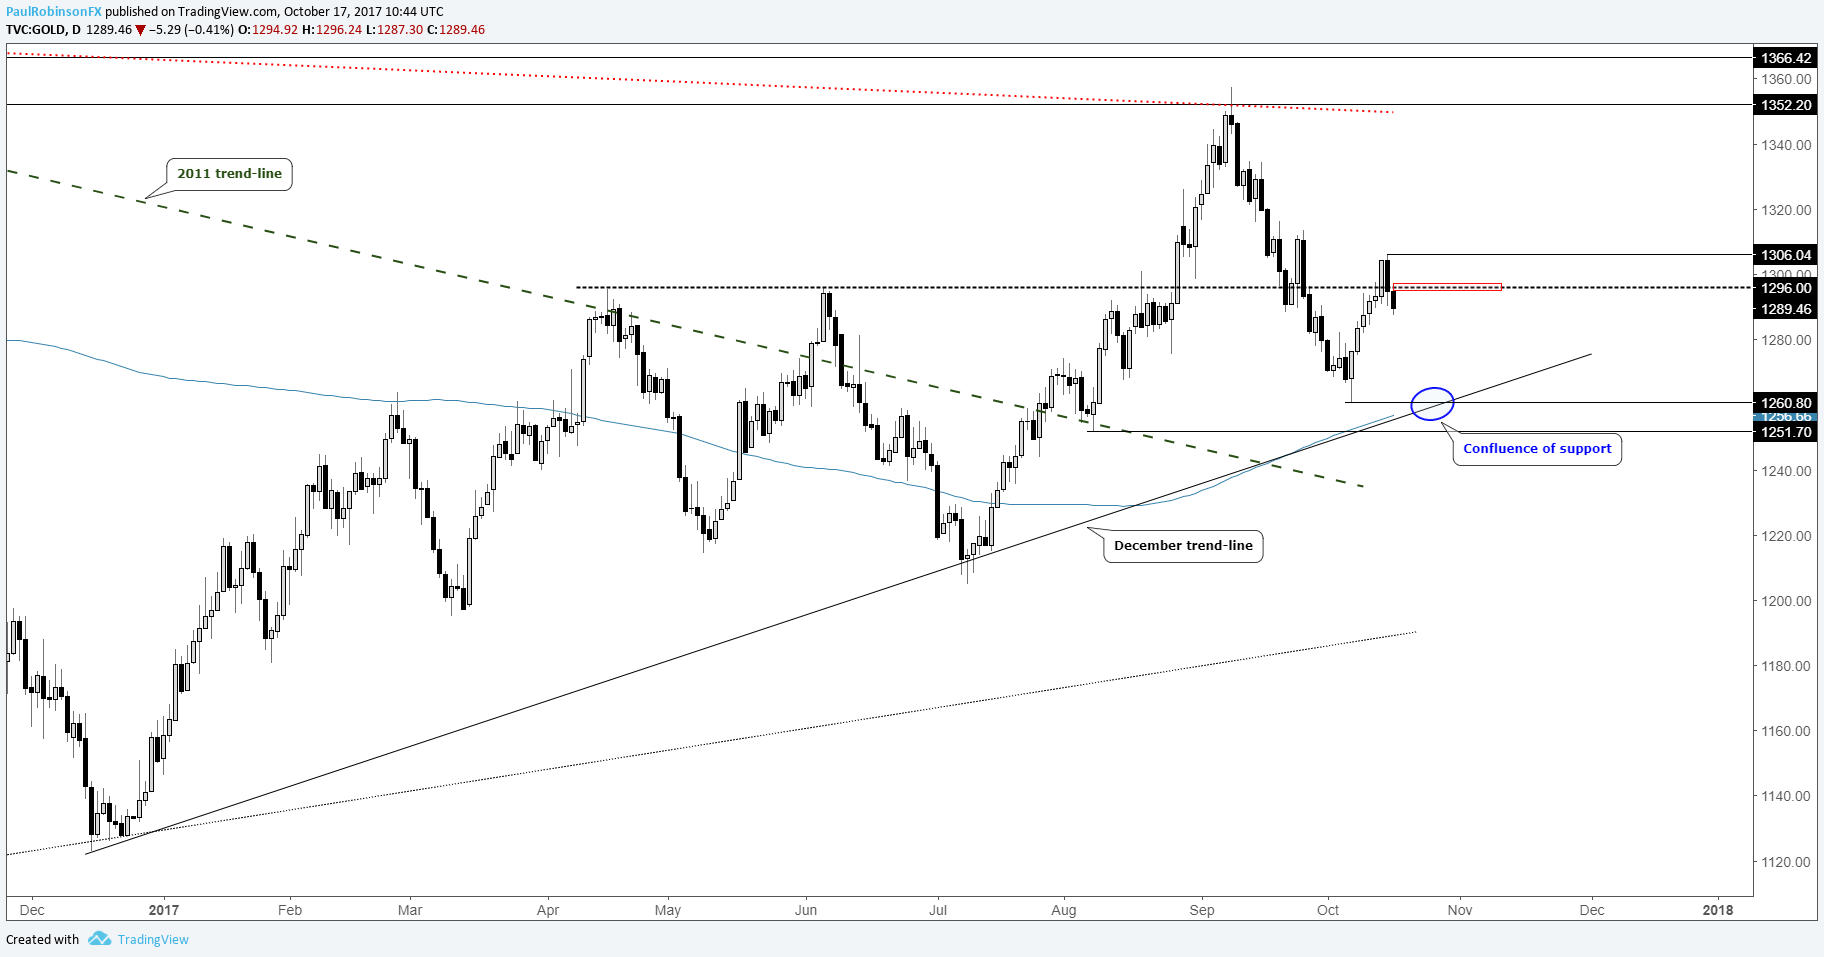
Gold breached the 1296/1300 threshold on Friday with the help of poor U.S. data, but then reversed course sharply to start the week. It appears to have been a fake-out and with the sudden drop the focus shifts lower. The US dollar looks poised to make a move higher, which could help the bears’ cause. Sustained trade below 1300 has attention on the December trend-line and rising 200-day MA, which could also be in confluence with the 10/6 low at 1261. Silver made a similar head-fake above resistance and the 200-day MA, and while the downside objective isn’t as clear, so goes gold goes silver.
Gold:Daily
Crude oil, as we discussed recently, could be putting in one of two H&S patterns (same type of pattern, but in opposing directions on varying time-frames). It’s currently trading at a big trend-line (‘neck-line’ of a bottoming inverse ‘head-and-shoulders’ formation). More intermediate-term, while it's sloppy, the trend off the June low is upward marked by a series of higher-highs and higher-lows. Day-to-day the volatility is daytrader-friendly, but beyond the intra-day time-frame the overall volatility is presenting problematic in garnering any real sense of direction. We also touched on Brent crude oil as well.
(The indices portion of the webinar begins here.)
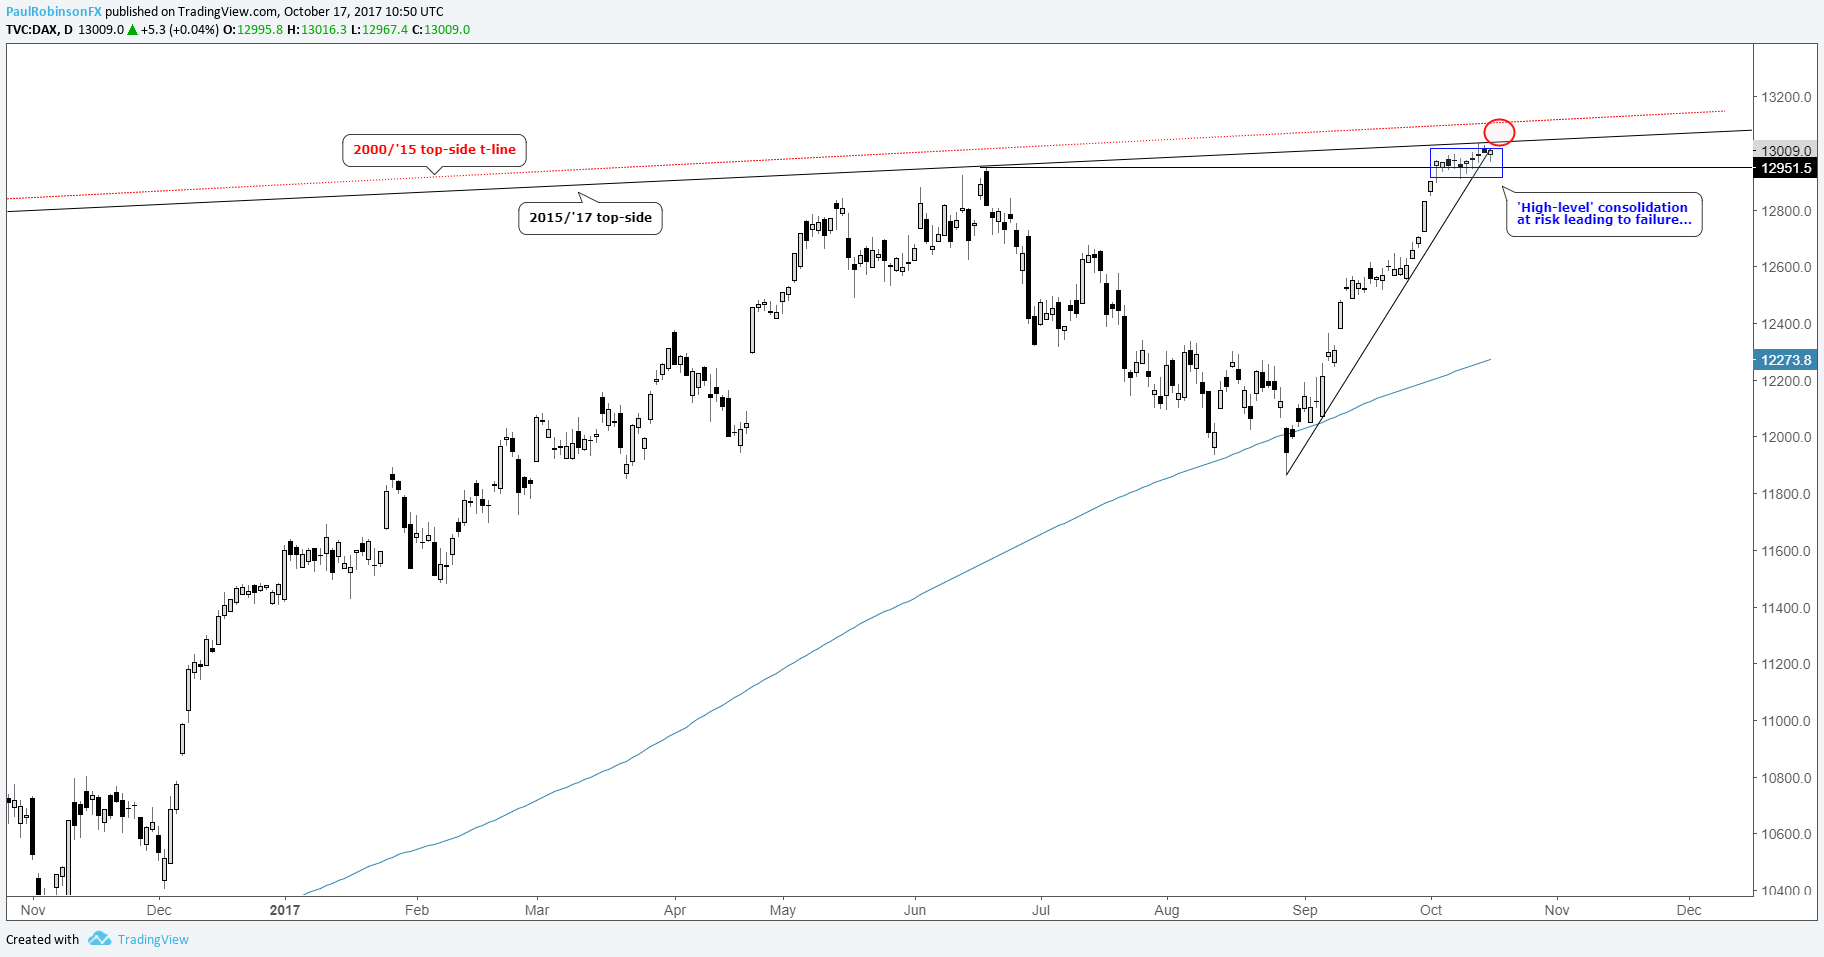
Global stock indices are strong to quite strong. The Nikkei is in full-on momentum-mode as it continues to climb the ladder of levels going back to 1996. The only visible level of resistance doesn’t arrive until the 1996 high at 22750. With that said, though, chasing here doesn’t offer good risk/reward. The DAX has gone into a very restricted range as it trades up against and near a pair of long-term top-side trend-lines. The high-level consolidation appears at risk of failing on a breakout, which if momentum is forceful enough to the downside could set up for a tradable pullback. The FTSE recently traded to a new record close, but has yet to breach the intra-day record high at 7599. There is support on a retest of the recently recaptured Feb 2016 trend-line. It seems likely we will see it hold and a push higher to a test of the intra-day record soon. The S&P 500 is grinding higher and until we see a sharp push and reverse it will be difficult for both sides of the tape. The Nasdaq 100 looks poised to rise to an intermediate-term top-side trend-line in the vicinity of 6160.
Check out this new trading guide – Building Confidence in Trading.
DAX: Daily
For full technical considerations, please see the video above…
---Written by Paul Robinson, Market Analyst
You can receive Paul’s analysis directly via email by signing up here.
You can follow Paul on Twitter at @PaulRobinonFX.


